
Quantity Take-offs
Quantity Take-offs is the page where work quantities are calculated from dimensions. It is unlike any other page in the application: this is not a list but a real spreadsheet.
1. What it is for
Quantity Take-offs is the page where work quantities are calculated from dimensions. It is unlike any other page in the application: this is not a list but a real spreadsheet. You write the item name and the dimensions into the rows, the quantity comes out by itself, and where you need it you can write formulas into cells just as you would in Excel.
A prepared sheet is saved to the project and filed under three headings. A saved sheet serves two purposes: it can be exported to Excel or PDF and handed to the subcontractor, the site supervision or the file; and it can be linked to an item in Site Data Entry as its source — there, instead of typing a quantity by hand, you say "select from a saved take-off" and the quantity comes from the sheet's total.
The questions the page answers are these: where did this item's quantity come from, which dimensions were multiplied, how much formwork is there in this block in total and who last updated this take-off, and when.
2. How to open it, who can see it
In the sidebar, Site Operations › Quantity Take-offs.
| Your permission | What you can do |
|---|---|
| View | You read the library, open a sheet, move around inside it, use the Filter menu and take Excel and PDF output. New take-off, the delete button, Save, Save as, Row, Column, Cell, Undo, Redo and Import from Excel are not drawn at all |
| Edit | Everything above, and you also create, fill in, save and delete sheets |
| No permission | The module appears dimmed and locked in the menu |
3. Anatomy of the screen
The page is two screens. The screen you land on is the library; when a sheet is opened or a new one is created, the sheet takes over the whole page. The one thing a spreadsheet needs is width.
The library
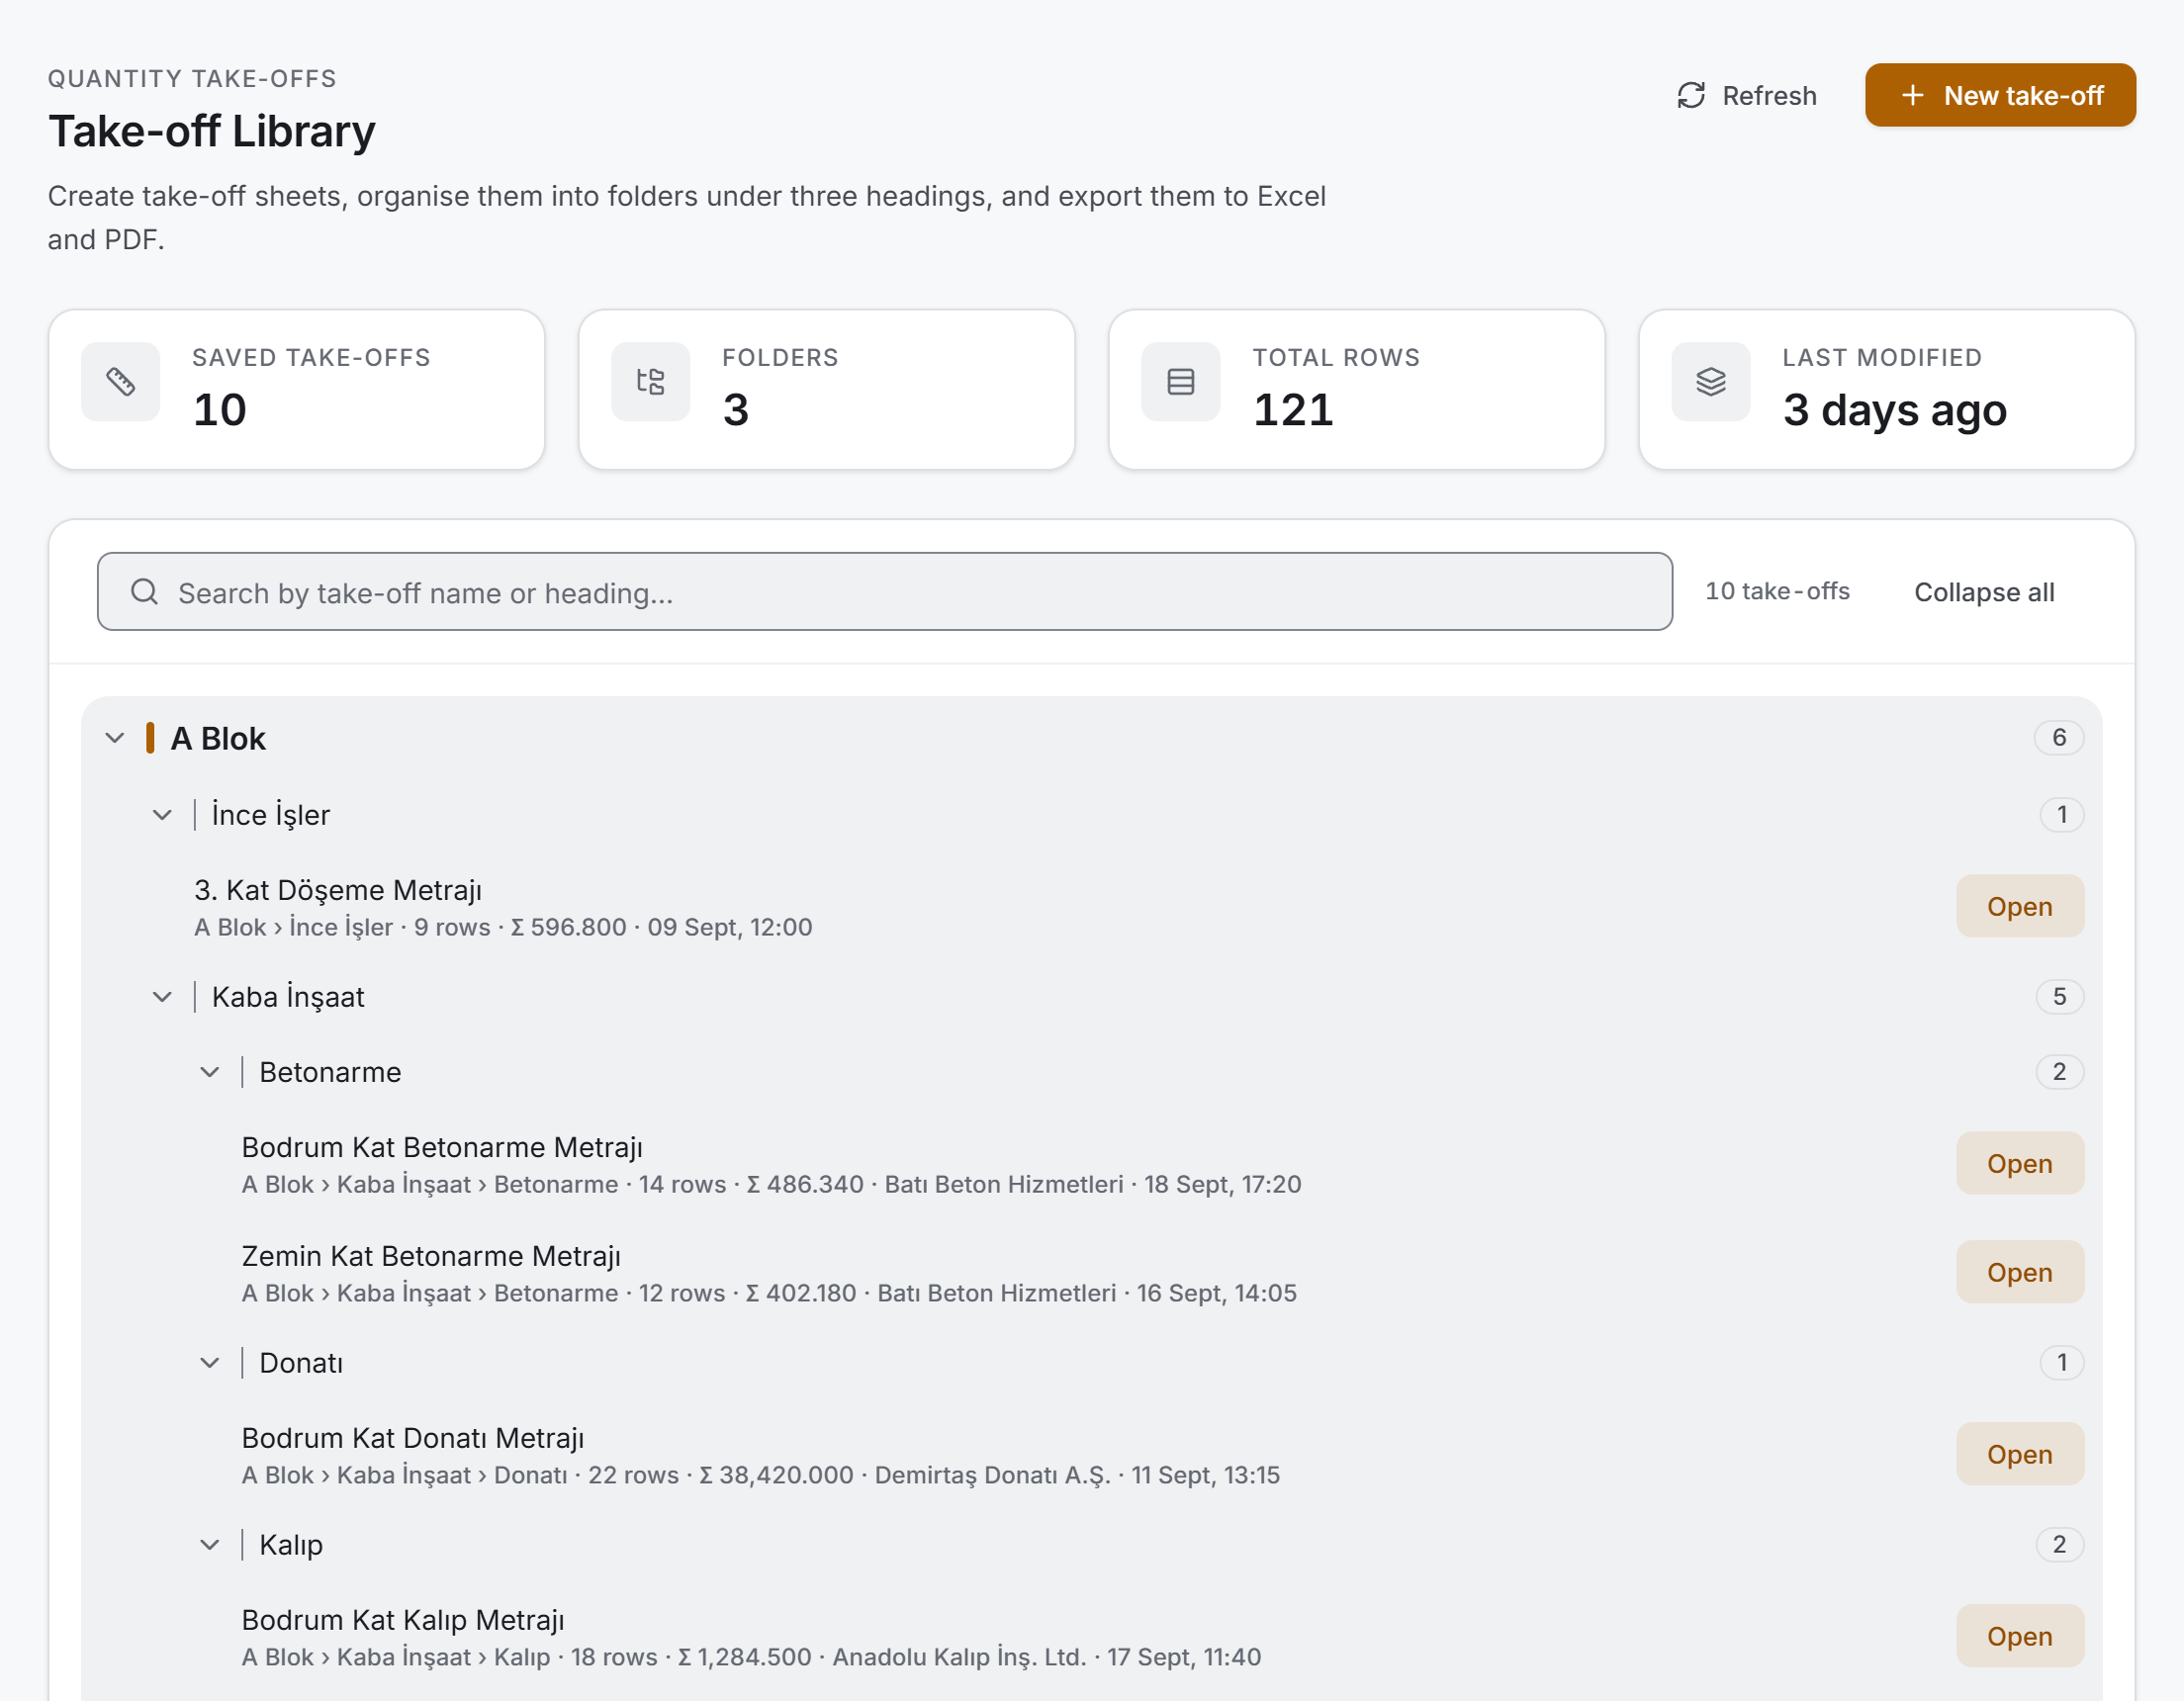
Four layers from top to bottom:
| Layer | What it does |
|---|---|
| Header | Take-off Library, with Refresh and New take-off on the right |
| Measure strip | Four figures about the project's take-offs |
| Search bar | Search box, match counter, Expand all / Collapse all |
| Folder tree | Up to three folder levels, with sheet rows underneath |
The line under the header reads: "Create take-off sheets, organise them into folders under three headings, and export them to Excel and PDF."
The four measures are Saved take-offs, Folders, Total rows and Last modified. All four are counted from the list that has already been loaded; a summary shown on screen does not cost a second request to the server.
The folder tree and a sheet row
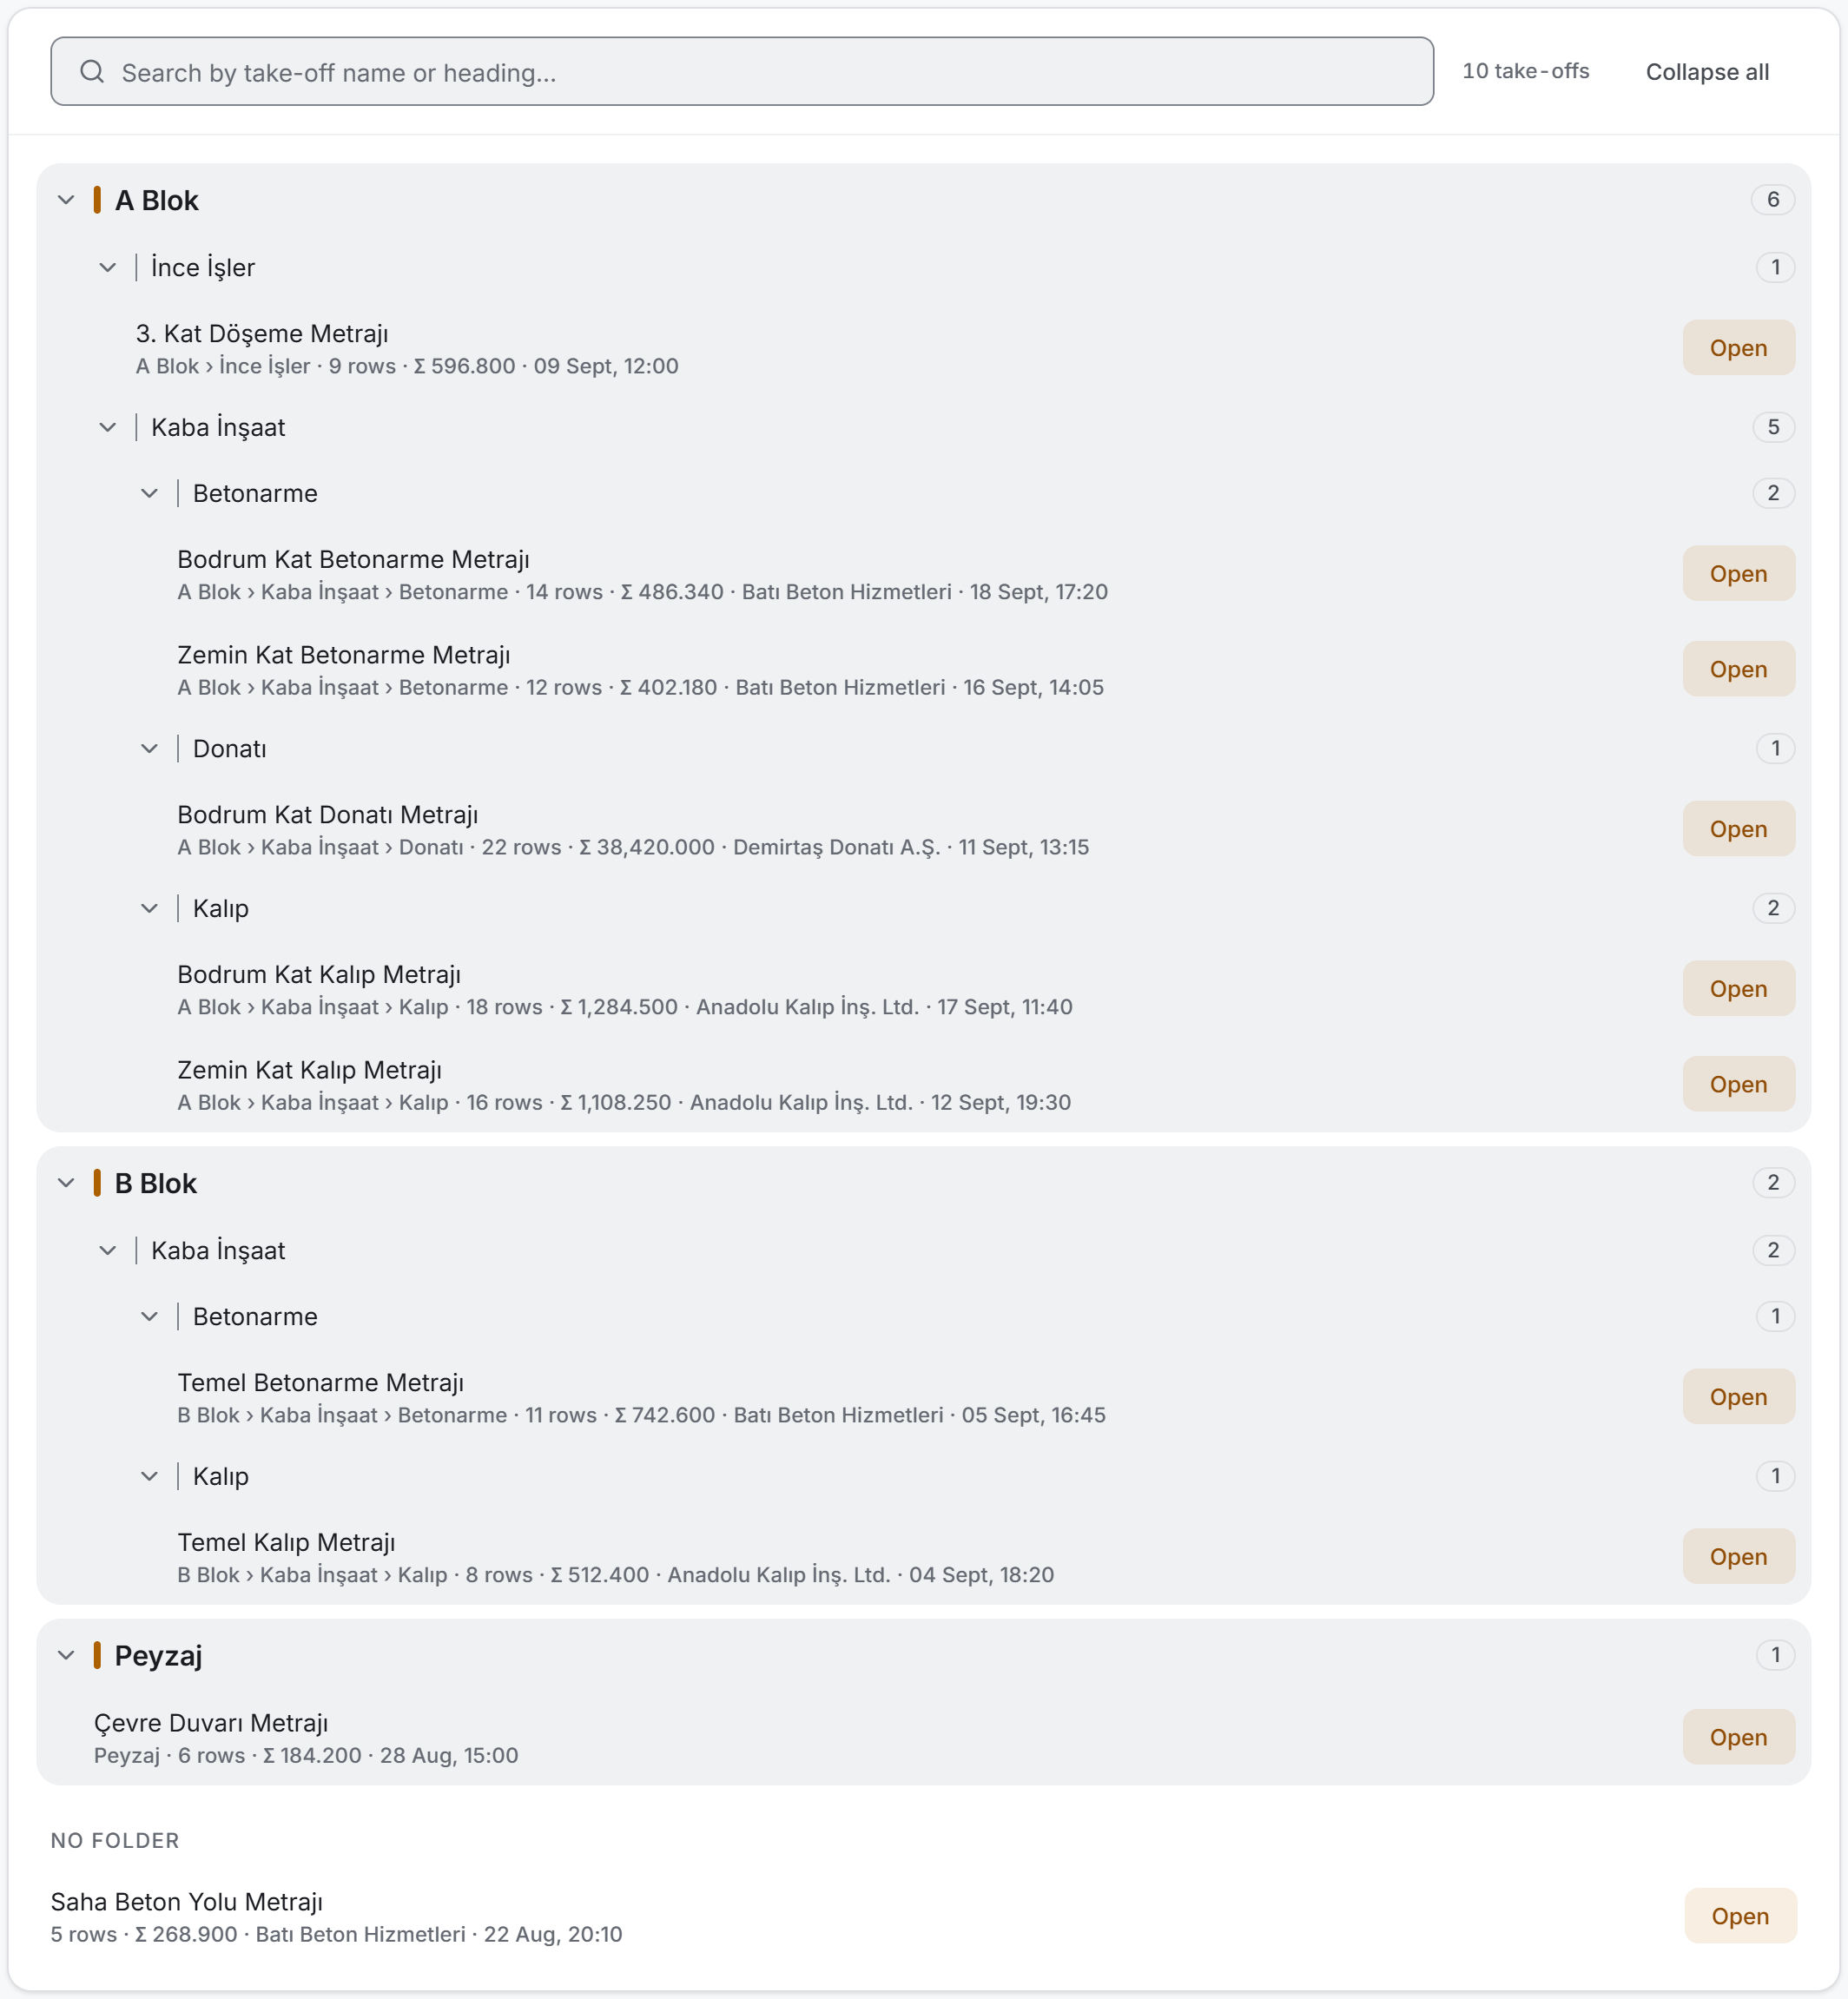
Sheets are arranged as a tree according to the three headings given when they were saved. The first level is boxed and bold, the second and third are drawn more lightly — in a three-level tree the eye reads the level from the weight, not from the indent. Each node carries a badge with the number of sheets inside it. Sheets saved with no heading at all sit below the tree, as plain rows under No folder.
Each sheet row carries the take-off's name on top and a one-line summary underneath: the folder path, the row count, the Σ total quantity, the subcontractor if there is one, and the time it was last modified. A sheet with no total shows Σ —.
Hovering over a row reveals three icons on the right — Export to Excel, Export to PDF and Delete take-off — and there is an Open button at the far right that is always there. Clicking the row itself opens the sheet as well.
When you type into the search box, every level of the tree expands by itself: in a collapsed tree a search result would look like "nothing found". While a search is running the Expand all / Collapse all button is not drawn either.
The library has three empty states, and each one names a different next step:
| State | What it says |
|---|---|
| No take-offs in the project | "No saved take-offs in this project" and a New take-off button. Without edit permission the button is replaced by "You do not have permission to create take-offs." |
| Nothing matches the search | "No take-offs match your search" and Clear search |
| The server could not be reached | "Take-offs could not be loaded" and Try again |
The sheet
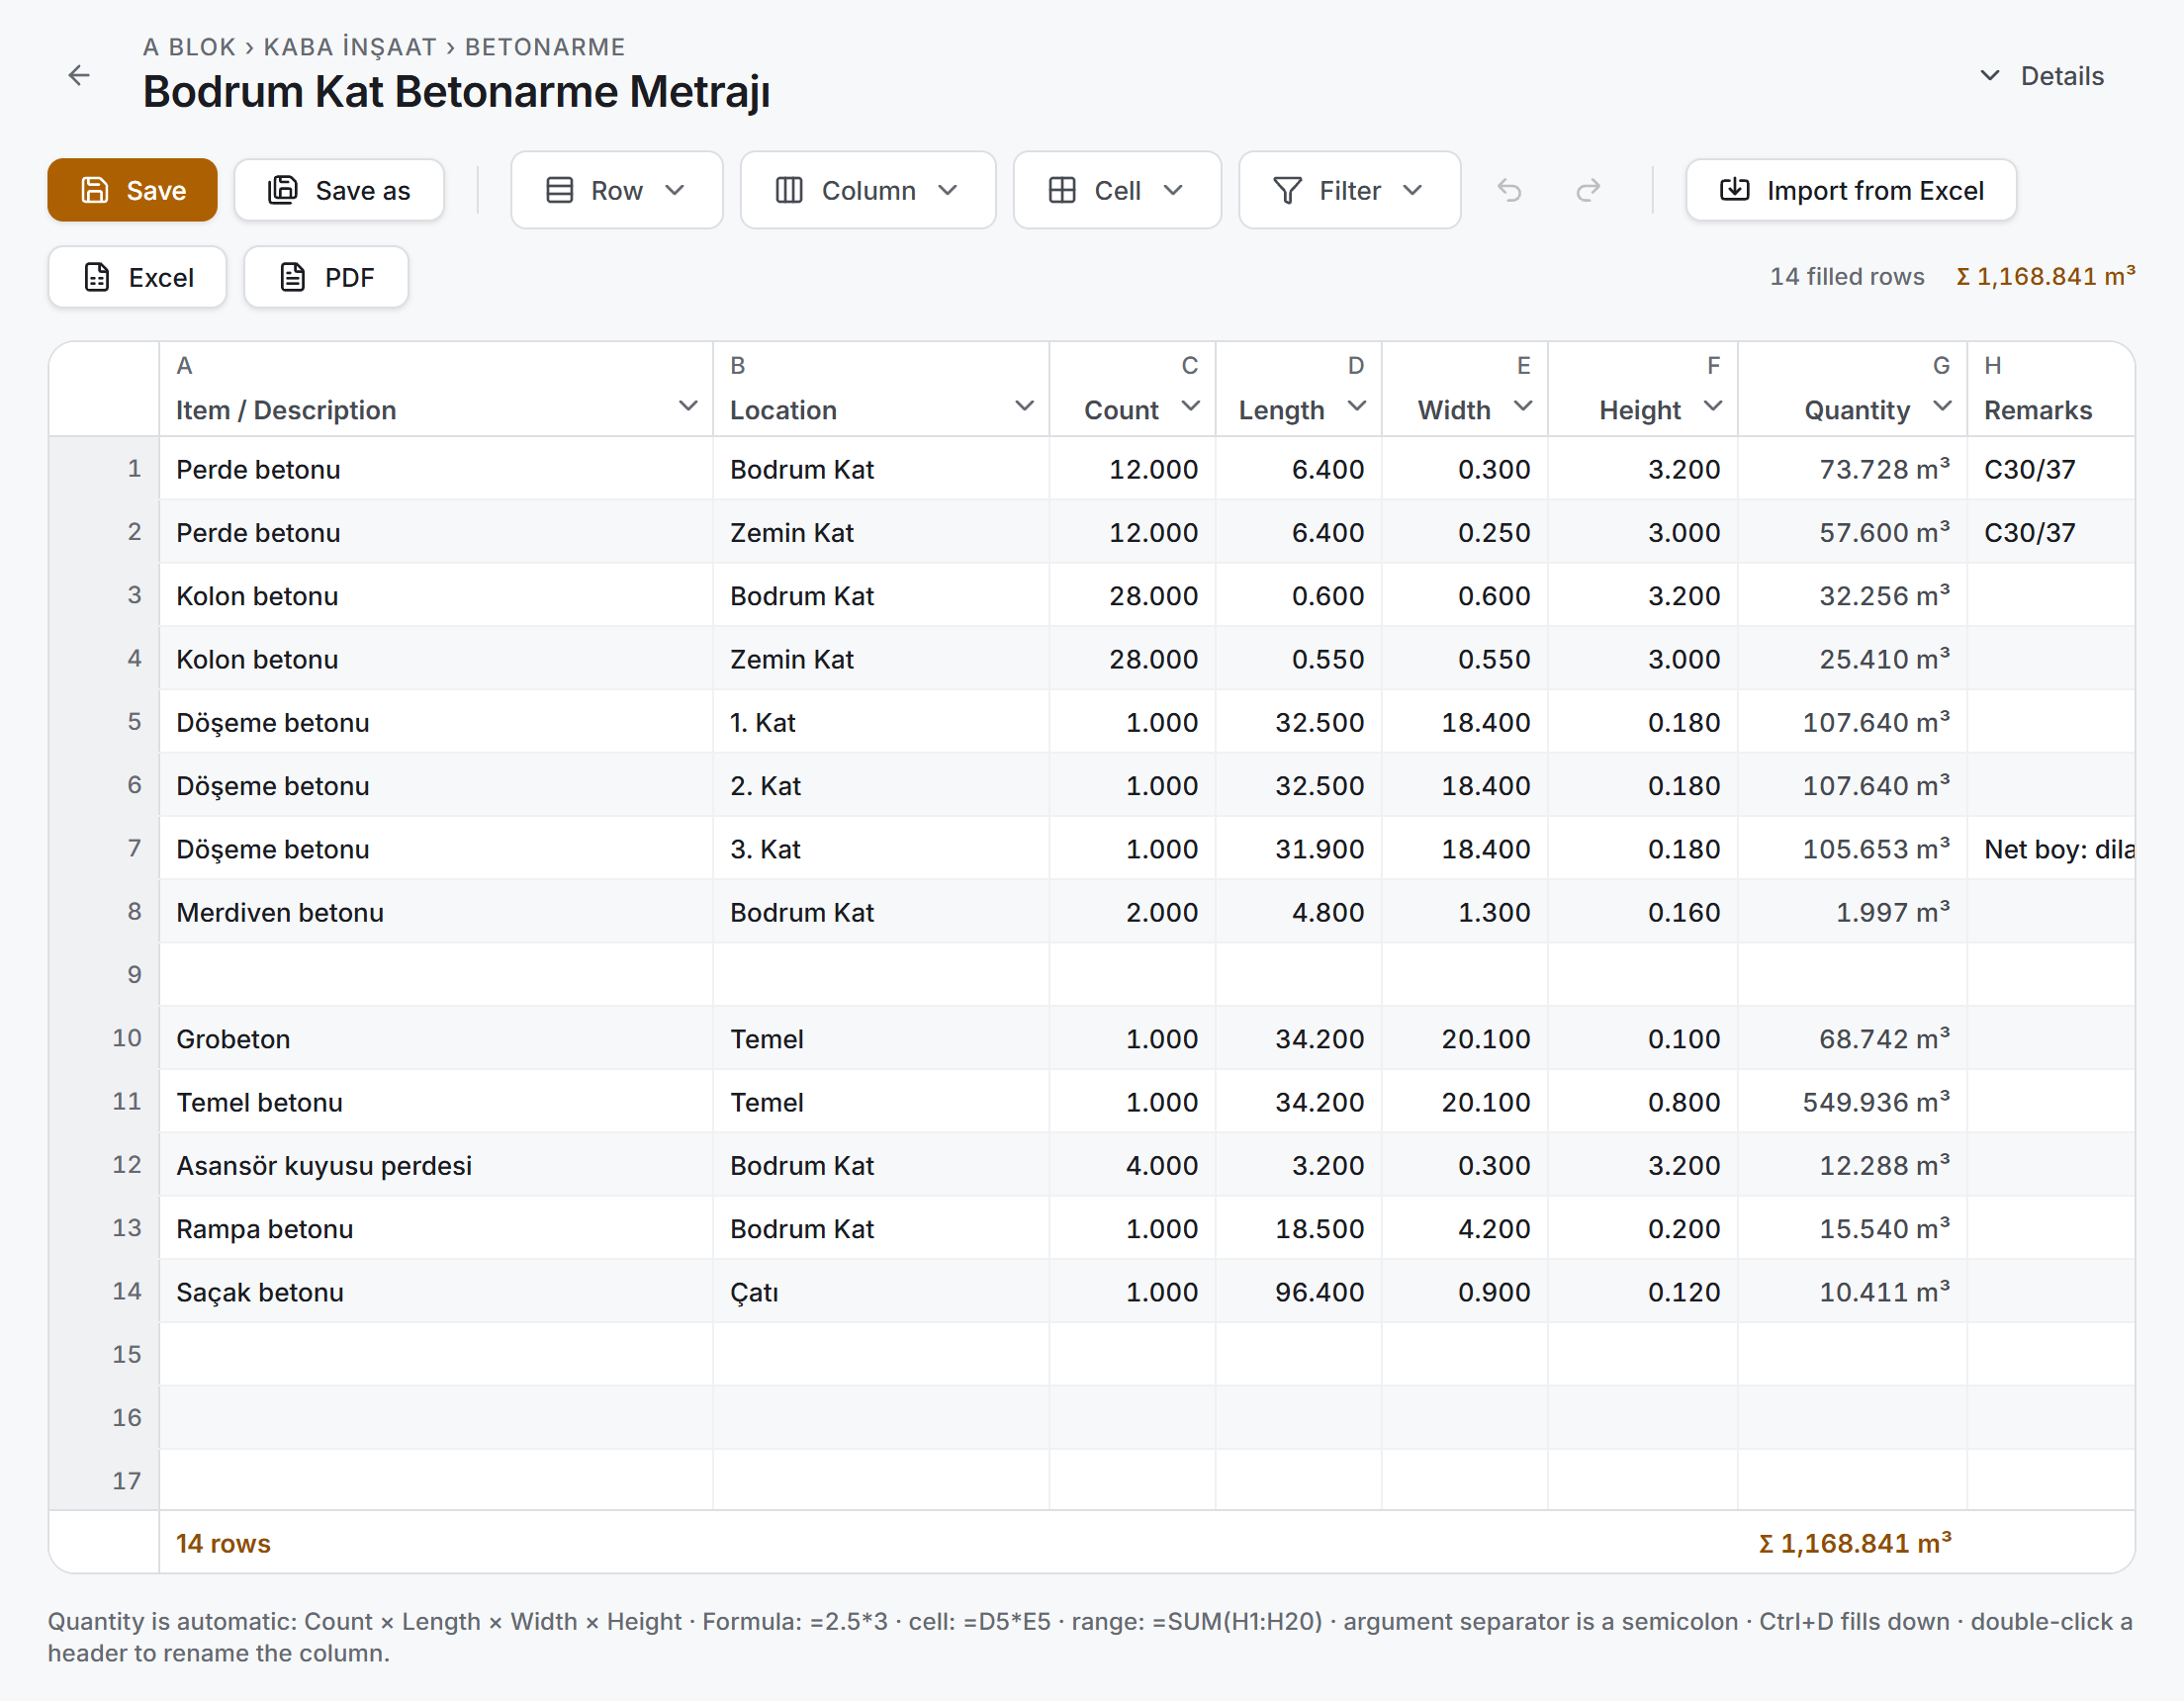
When a sheet is opened, the screen splits into four layers:
| Layer | What it does |
|---|---|
| Top strip | Back button, folder path, take-off name, status badges, the Details switch |
| Details strip | Three folder fields, take-off name, subcontractor and the "Saved in" preview (collapsible) |
| Toolbar | Saving, four menus, undo/redo, import and two outputs |
| Grid | The sheet itself, with a one-line hint underneath |
At the far left of the top strip sits the Back to library arrow. Next to it are two lines: the folder path on top ("A Blok › Kaba İnşaat › Betonarme"), the take-off's name below. If no name has been given yet it reads Untitled take-off; if no folder was given, the path line reads No folder.
Two badges can appear on the right: an amber Unsaved changes while there is an unsaved change, and a blue filter badge while a filter is on. The rightmost button opens and closes the details strip and its label changes accordingly — Hide details when open, Details when closed.
The details strip

Five fields sit side by side, and the order is the tree's order, read from folder towards take-off:
| Field | What goes in it |
|---|---|
| Folder (optional) | First level — "A Blok" |
| Subfolder (optional) | Second level — "Kaba İnşaat" |
| Sub-subfolder (optional) | Third level — "Betonarme" |
| Take-off name | The sheet's name — "3rd Floor Slab Take-off" |
| Subcontractor (optional) | One of the project's subcontractors; Not selected if none |
All three folder boxes suggest headings already used in the same project; the subfolder suggestions narrow according to the level above. Choosing a suggestion is not required — you can type whatever you like into the boxes.
Under the strip is a one-line preview: Saved in: followed by where the sheet will land in the tree. This line updates as you type and shows immediately that a level left empty never appears in the tree. If no name has been typed, it reads (no take-off name entered).
The details strip comes up collapsed when a saved sheet is opened and expanded when a new sheet is created: in a saved sheet the name and headings are already settled and your work is in the figures.
The toolbar

From left to right:
| Button | What it does |
|---|---|
| Save | Saves the open sheet. It reads Saving… while it runs |
| Save as | Saves the open sheet as a new record |
| Row | Menu for inserting and deleting rows and for row height |
| Column | Menu for adding, deleting, renaming and freezing columns |
| Cell | Menu for merging, unmerging and units |
| Filter | Menu for filtering, clearing the filter and sorting |
| Undo / Redo | Takes back the last operation, or puts it back |
| Import from Excel | Opens the import window |
| Excel / PDF | Writes the sheet to a file |
At the right end of the bar are two figures: N filled rows and, next to it, Σ with the quantity total. Both change as you type. The total carries its unit as well; if the units in the sheet are mixed it reads (mixed units) instead.
The Row, Column and Cell menus go dim while a filter is on, and are not drawn at all without edit permission. The Filter menu opens under any condition.
The grid
The grid's header is two lines: the Excel-style column letter on top (A, B, C…), the column's name underneath. The letter is needed when writing formulas — someone typing =D5*E5 has to see which column D is. On the left is a gutter carrying the row numbers, and at the very bottom a thin totals strip.
The totals strip holds two figures: the row count under the leftmost column, and Σ with the quantity total under the Quantity column. The row count sits on the left deliberately; under any other column it would read as if it belonged to that column.
Under the grid is a single line of hints naming the formula language: how the quantity is calculated, formula examples, the fact that the argument separator is a semicolon, and that Ctrl+D fills down.
4. Fields
The sheet's columns are not fixed. Every take-off carries its own column layout: a new sheet opens with the columns below, but columns can be added, deleted, renamed and moved.
| Column | What it means | Type | In a new sheet |
|---|---|---|---|
| Item No | Unit-price item number | Text | No |
| Item / Description | The name of the work — "Shear wall concrete" | Text | Yes |
| Location | Where the work is — "3rd Floor", "Block A" | Text | Yes |
| Count | The number of elements of the same size | Number | Yes |
| Length | Length dimension | Number | Yes |
| Width | Width dimension | Number | Yes |
| Height | Height or thickness dimension | Number | Yes |
| Quantity | The product of the four dimensions — automatic | Number | Yes |
| Unit | Unit as plain text | Text | No |
| Remarks | Free note | Text | Yes |
Item No and Unit are defined but do not come with a new sheet. A unit is no longer a separate column but part of the cell's number format (see §5). Both can be brought back from the Add column window; if an older sheet has them, they are drawn as they are.
No field is mandatory. A row counts as filled if any cell in it has content: text, a number or a formula. A row that only has a unit assigned, only a changed row height, or an error marker in it is empty — formatting is not content. That distinction matters in the outputs, because empty rows are not printed to the files.
How the quantity is calculated
Quantity = Count × Length × Width × Height. The rule relaxes in two places, and both are deliberate:
- A dimension left empty does not enter the product at all — not as 1, but as absent. In a row where only Length and Width are given, the quantity is the product of those two.
- A dimension written as zero is a real zero. Leaving a box empty and writing 0 are different things; in a row with a 0 the quantity is zero.
If all four dimensions are empty, the quantity cell stays empty. The quantity cell is drawn in a different colour but is writable: if you type a number or a formula into it, that row counts as manually entered and the quantity is not overwritten even if you change the dimensions afterwards. Clear the cell and it returns to the automatic calculation.
5. Step by step
Creating a new take-off
- In the library, choose New take-off. An empty sheet opens with forty working rows.
- In the details strip, type the Take-off name; if you want, pick one, two or three folder levels and a subcontractor.
- Fill in the rows.
- Choose Save.
Filling in rows
Starting to type into a cell opens editing; F2 and a double-click open it too. There is an Excel-like difference between the two: when you start typing, the arrow keys write the value and move to the neighbouring cell; when opened with F2, the arrow keys move the caret inside the text.
| Key | What it does |
|---|---|
| Arrow keys | Move between cells; with Shift they grow the selection |
| Enter | Moves down a row; with Shift, up |
| Tab | Moves right; at the last column it jumps to the start of the row below |
| Home / End | Go to the start and the end of the row |
| Ctrl+Home / Ctrl+End | Go to the start and the end of the sheet |
| PageUp / PageDown | One screen up, one screen down |
| Delete or Backspace | Clears the selected cells |
| Ctrl+A | Selects the whole sheet |
| Ctrl+D | Fills the cell above downwards |
| Ctrl+Z / Ctrl+Y | Undo, redo |
| Esc | Cancels editing |
Pressing Enter on the last row opens a new row, so you do not come to a stop at the end of the sheet.
Both a comma and a dot are accepted as the decimal separator: someone typing 3.5 in English mode and someone pasting 3,5 from Excel both get the right number. On screen the figures are shown according to the application's language.
Copy and paste work and are compatible with Excel: the copied area goes to the clipboard as tab-separated text, and an area copied from Excel can be pasted as it is. If the pasted area runs past the sheet, the missing rows are opened.
The small square at the bottom-right corner of a selection is the fill handle; dragging it fills in the direction you drag. Series are recognised in numbers: two cells reading 1 and 2, dragged down, continue 3, 4, 5.
Writing formulas
Typing text that starts with = into a cell is writing a formula. What is supported:
| What | Example |
|---|---|
| Constants and the four operations | =(2+3)*4 |
| Cell reference | =D5*E5 |
| Range and function | =SUM(H1:H20) |
| Absolute reference | =D5*$B$1 |
Function names are valid in both English and Turkish: SUM · AVERAGE · MIN · MAX · COUNT · PRODUCT · ROUND · ABS · CEILING · FLOOR · SQRT · PI and their Turkish equivalents (TOPLA, ORTALAMA, MAK, SAY, ÇARPIM, YUVARLA, MUTLAK, TAVAN, TABAN, KAREKÖK, Pİ).
While writing a formula, if the caret is somewhere a reference is expected (at the start, or after an operator, a bracket or a separator), the arrow keys and a mouse click select a cell and the chosen reference is written into the text. It is the same as Excel's "point" mode: typing = and pressing the up arrow turns the text into =C1. Typing any other character closes the mode by itself.
A formula that cannot be calculated writes an error marker into the cell: #VALUE!, #DIV/0!, #NAME?, #REF! or #CYCLE!. The markers follow the application's language; in Turkish mode you see #BAŞV!. Excel does the same.
Working with columns
Column operations live in the Column menu and in the menu that opens on a right-click. Both carry the same actions.
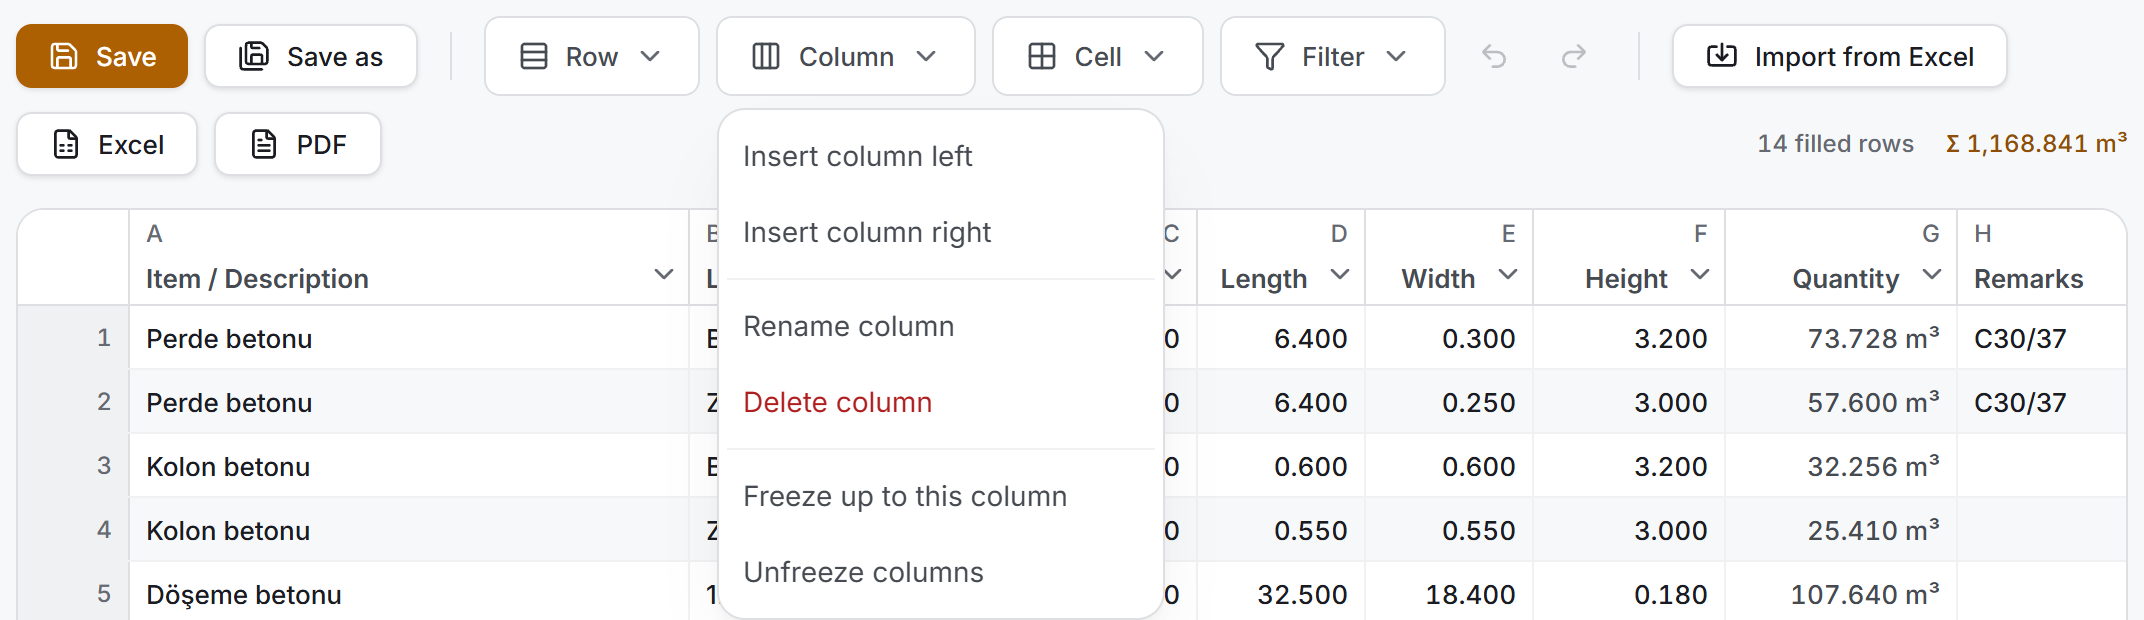
- Choose Insert column left or Insert column right. The Add column window opens.
- The window offers two choices: Create a new column or bring back a system column that was deleted.
- Give the new column a name and choose its type — Number or Text. Number columns can contain formulas and can have a unit.
- Choose Add.
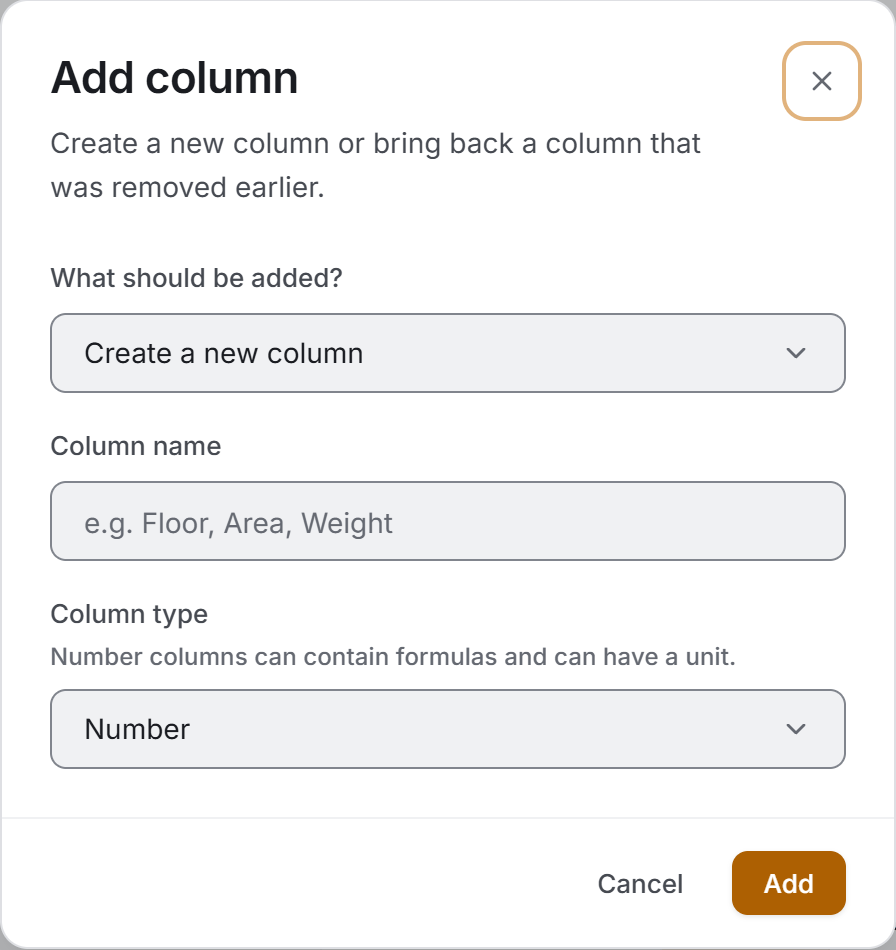
To rename a column, double-click its header or choose Rename column from the menu. The width changes by dragging the edge of the header; the width is saved with the sheet. To move a column, grab its header and drag.
Freeze up to this column pins the selected column and every column to its left: they stay in place when you scroll right. The rightmost column cannot be frozen, because at least one column must stay in the scrolling area. Unfreeze columns releases them all.
Delete column brings up a confirmation that says three things: how many filled cells the column has, that a system column can be brought back with Add column, and that formulas referring to that column will show #REF!.
Assigning a unit
A unit does not touch the cell's value; it is only added to the display. Formulas and totals keep seeing the plain number.
- Select the cells that are to get a unit. For a whole column, click its header.
- Choose Cell › Set unit…, or right-click and choose the same thing.
- Pick one of the ready-made units — Metre — m, Square metre — m², Cubic metre — m³, Linear metre — mtül, Pieces — or type your own into the Unit box.
- Choose Apply. To remove a unit, choose Remove unit.
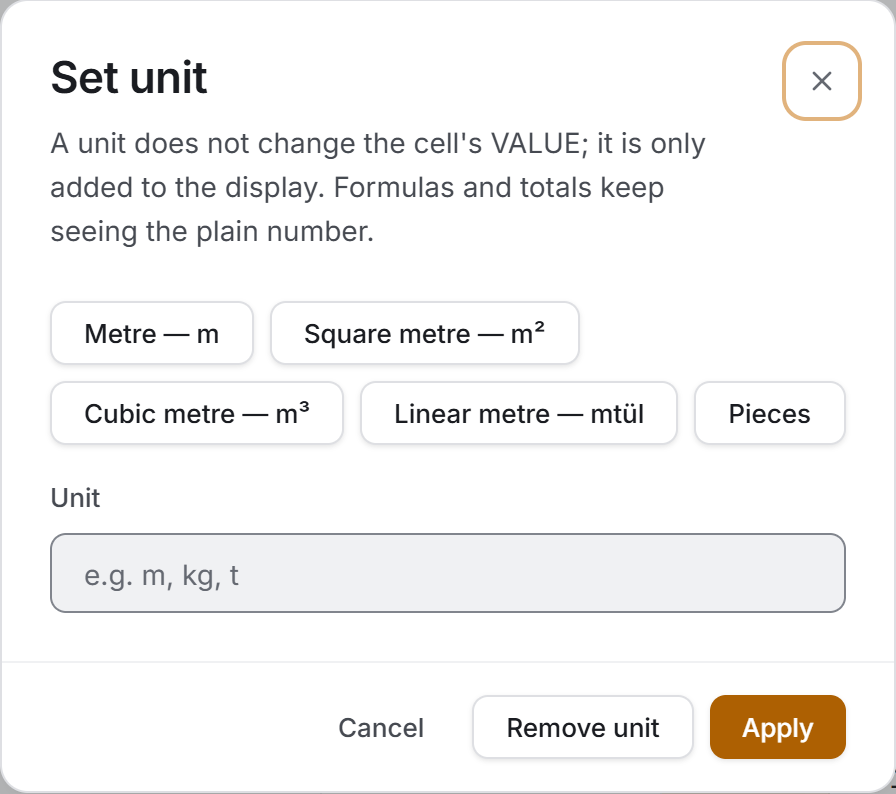
A unit is applied to number columns only. If cells from a text column are selected and a unit is asked for, the application gives a calm warning and names which columns are number columns.
Merging cells
- Select the cells to be merged — at least two.
- Choose Cell › Merge cells.
- If the selection has filled cells other than the top-left one, a confirmation appears naming how many cells' contents will be deleted. Excel does the same.
- To undo it, select the merged area and choose Unmerge.
A merge cannot cross the frozen column boundary; you have to keep the selection on one side or remove the freeze.
Row height
- Select the row or rows.
- Choose Row › Row height….
- Give a value in pixels — between 16 and 160.
- If Apply to all rows (sheet default) is ticked, the value becomes the sheet's default and the per-row overrides are cleared. Reset to default puts the selected rows back to the default.
If a default and a per-row height were both in force at once it would be unclear which one wins; that is why "apply to all rows" clears the others.
Filtering and sorting
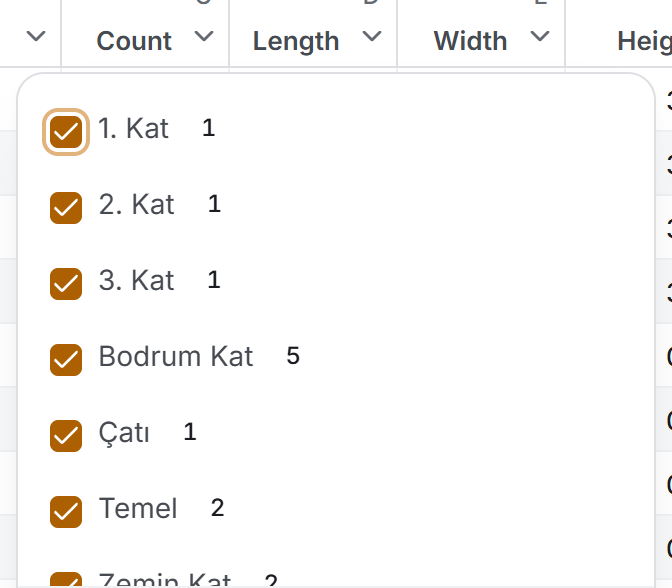
There are two kinds of filter and they work together:
- Column filter — inside every column header there is a small filter button. The menu that opens lists the values in that column and how many rows each one appears in. Empty cells sit in the list under the name (Blank).
- Text filter — the window opened with Filter › Filter… searches for free text. The search can run across every column or be limited to one chosen column.
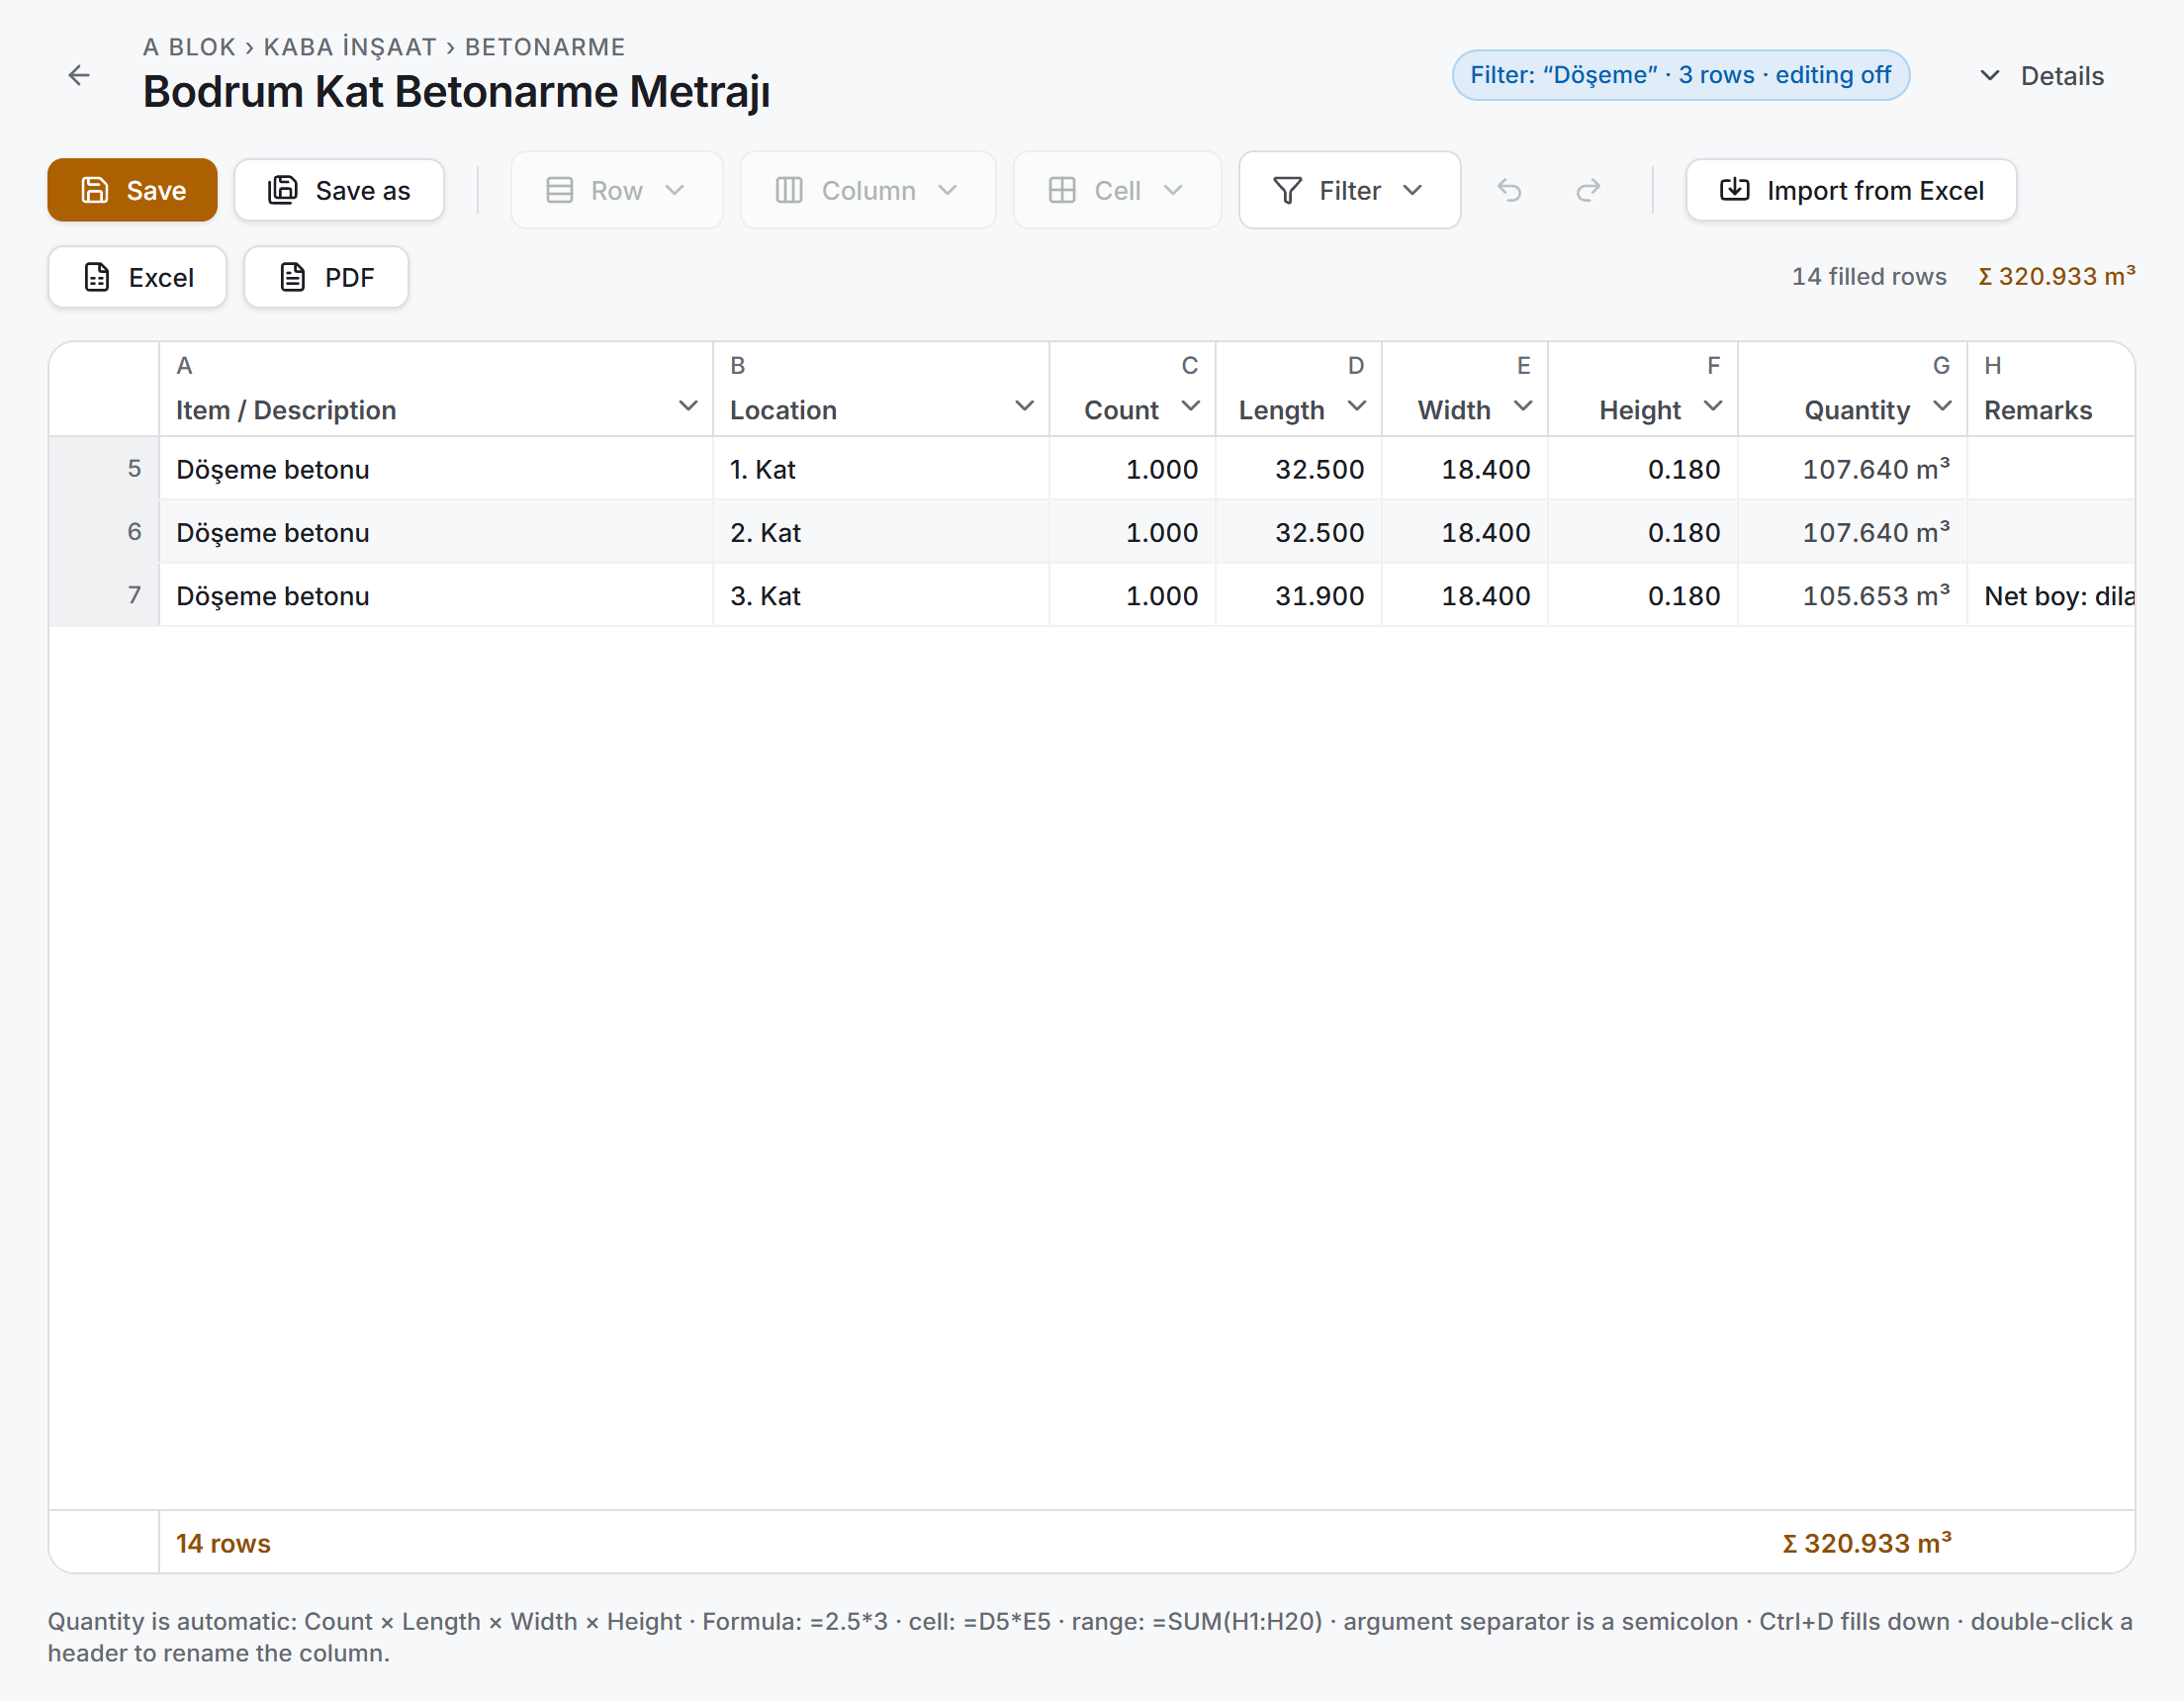
While a filter is on, a badge sits in the top strip naming which columns are filtered, how many rows are left, and that editing is off.
If no row matches the search, the filter is not applied: rather than dropping to an empty table, the page gives a calm warning and the previous view stays where it was.
To sort, select a cell in a column and choose Filter › Sort by selected column. There are two directions, A → Z and Z → A. Empty cells go to the end in both directions. Sorting is refused in two cases, and it says why: while a filter is on, and while the table has merged cells spanning more than one row.
Importing from Excel
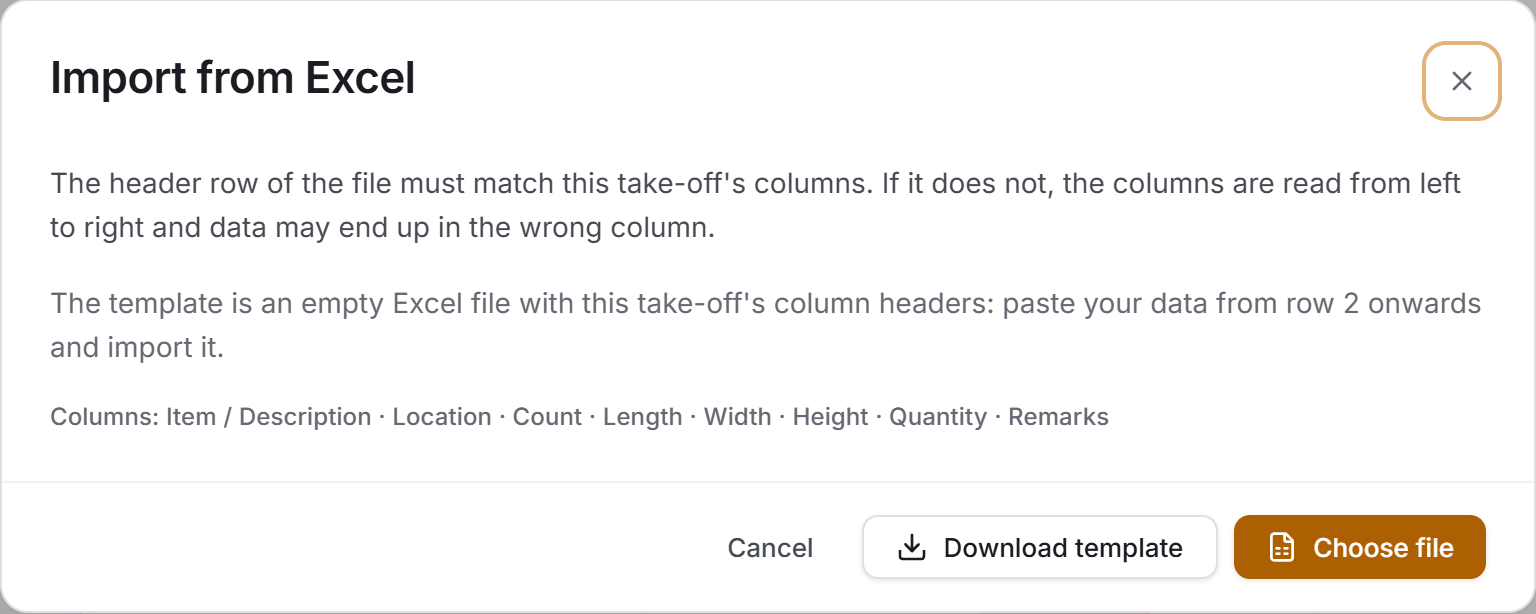
There are four steps, and no row is written until the preview is confirmed.
- Choose Import from Excel. In the window that opens, either choose Download template and take an empty file, or choose a file directly. The template is an empty Excel file carrying this sheet's column headers: you paste your data from row 2 onwards and import it back.
- If the file has more than one sheet with data, you are asked which one to import.
- The preview appears: how many rows were read, which columns matched, how many formulas were converted, and the first few rows.
- Finally you are asked what happens to the existing rows — Replace existing rows swaps the whole open sheet for the file, Append writes the rows below the existing ones.
If the file's header row matches the sheet's columns, the columns are matched by name, even if their order differs. If the header is not recognised, the columns are read from left to right and the window says so plainly; the sample rows in the preview are where you confirm that the data landed in the right columns.
Saving
Save updates the open sheet. Save as writes it as a new record — that is how you produce a second version of the same sheet.
If another sheet with the same name exists under the same folder path, one of two things happens:
- If the sheet is already saved, "A take-off with the same name exists" appears and offers Overwrite.
- If you try to save under the same name with Save as, nothing is saved; the strip asks you to give a different name or to change one of the headings. Producing two copies with the same name in the same place would make it impossible to tell later which one is right.
If saving cannot reach the server it says "The take-off could not be saved" and your rows stay on screen.
Deleting a take-off
- In the library, hover over the sheet and press the bin icon.
- The window names the take-off and how many rows it contains.
- Choose Delete.
6. Outputs
There are three outputs and all three open Windows' save dialog. If you choose Cancel, nothing is written and nothing is said on screen either. Only one file is prepared at a time; while one is running the other buttons wait. When a file has been written, a green strip appears at the bottom of the page naming the file that was saved; you close the strip with OK.
| Output | Where you take it from |
|---|---|
| Excel | Excel in the sheet, the Excel icon on the row in the library |
| PDF in the sheet, the PDF icon on the row in the library | |
| Import template | Download template in the Import from Excel window |
The file name comes ready: the take-off's name, then the date and time the output was taken. A sheet with no name comes down as Takeoff, and the template starts with Takeoff_Template. Characters that cannot be used in a file name are turned into underscores.
Excel
A single-sheet workbook. The worksheet is named Take-off.
At the top sits a header block, each of its lines merged across the width of the table: the project name, the take-off's name, the folder path, the subcontractor and the moment the output was taken. If no folder or subcontractor was given, those lines are not written at all. Below it comes an empty separator row, then the header row in white on an orange fill, then the data. At the very bottom is the TOTAL row: the label goes into the column to the left of Quantity, the total itself into the Quantity column, and it is a live sum formula.
This output has three properties:
- Numbers are numbers and units are embedded in the format. A cell reading 63.504 m² is a real number in Excel and can be summed; the unit is part of the number format. Written as text, the file would have become uncalculable.
- Formulas come out live. The formula you wrote is converted into an Excel formula; if the quantity is calculated automatically, a live product goes to Excel too, so changing a dimension in the file changes the quantity as well.
- The header row is frozen and carries an auto-filter. Merged cells come out merged in Excel too.
A landscape A4 table output. At the top left is the project name in amber, with the take-off's name and folder path below it; at the top right sit Date, Rows, Subcontractor if there is one, and Total in bold.
Below comes the sheet's table. There are no vertical rules — the columns are separated by space; number columns are right-aligned and Quantity is bold. The unit in a cell appears in the report as well. Under the table is the TOTAL row. From the second page onwards both the top strip and the table header repeat; the page number sits at the foot of the page.
Empty rows are not printed, and the Rows figure at the top right counts the rows that were printed — a ninety-one-row sheet with one empty row in it says Rows: 90.
The template
An empty Excel file carrying the sheet's column headers. It is there for pasting your data from row 2 onwards and importing it back with Import from Excel.
7. Things worth knowing
Empty rows are not printed to the outputs. The empty rows in between stay in the sheet but are not written to the Excel and PDF files. The definition of "empty" matters here: only content makes a row filled. When you select the whole Quantity column and assign a unit, a unit lands on the empty working rows too — those rows are still empty and do not go into the output. Formatting is not content.
The empty rows in between are kept in the sheet. Only the empty working rows at the end of the sheet are dropped. Had the ones in between been dropped, the row numbers in formulas would have pointed at different cells.
Some formulas turn into values in Excel. Because empty rows are not printed, the row numbers shift in the file; the application builds a mapping and rewrites the formulas accordingly. But a formula that refers to a row that was not printed cannot be mapped — a calculated value is written into that cell instead. The number is right, only that cell is not live in Excel. A half-converted formula means a silently wrong take-off.
No total is written for mixed units. If the quantities in the sheet carry different units, the total reads (mixed units) instead. Cubic metres and square metres are not summed; had a total been calculated and written anyway, that figure would go into a progress payment and nobody there would see that the units were mixed.
Rounding is the same as in the old application. Products are rounded to six decimal places and halves are thrown away from zero. A rounding difference in a take-off goes straight into a progress payment, so the two applications have to produce the same figure.
There is no horizontal scroll bar. Scroll bars are hidden throughout the application. In a wide sheet, the "there is more on the right" cue is carried by the edge of the frozen band and by the column letters; scrolling sideways with the mouse wheel needs Shift. The main way to move around is the arrow keys and Tab, both of which bring the cell into view by themselves.
Column names change between the two languages, the names you give do not. The headings of system columns are not written into the record, they are translated on every draw — a sheet saved in English mode says İmalat / Tanım in Turkish mode. The name of a column you added yourself is data and stays as it is.
A filter selection can go stale when the language changes. If you tick (Blank) in a column filter and then change the language, the selection will not match (Boş) and that column's filter falls through. Clearing the filter and setting it again is enough.
The row counter and the total do not count the same rows. The N filled rows at the right of the toolbar and the N rows in the totals strip count every row up to the last filled row in the sheet, including the empty ones in between. The Σ next to it sums only the genuinely filled rows and, while a filter is on, takes only the visible ones. So while filtering, the figure on the left describes the whole sheet and the total on the right describes the visible rows. The number of visible rows is written on the filter badge in the top strip, and the row count in the outputs counts filled rows too.
A saved sheet looks empty for a moment while it opens. While the rows are coming down from the server, the empty state of a new sheet stands on the screen and the title reads Untitled take-off. On a fast connection this is a blink; on a slow one the sheet may look as if it has been emptied. The screen fills by itself when the rows arrive — do not type while it does.
A sheet is a snapshot. The library and the open sheet show the data that came down the moment they were opened. If someone else has added or changed a take-off in the meantime, you have to choose Refresh to see it. If two people edit the same sheet at the same time, the last one to save wins.
Error markers are not saved. A #REF! or #CYCLE! in a cell is rebuilt on every calculation and dropped when saving. An error that has since been fixed does not hang around in the file.
The values of a deleted column do not pile up in the record. When a column is deleted and the sheet saved, that column's values are dropped too; otherwise the file would grow a little with every deleted column and nothing would ever read that data again.
Mixed units are not accepted when linking a saved take-off. When a saved take-off is chosen as the source of an item in Site Data Entry, the quantity and the unit come from the sheet's total. If the sheet has more than one unit, the selection is undone and a warning appears there — a quantity whose unit is unclear should not go into a progress payment.
8. Related sections
- Site Data Entry — a saved take-off is linked there as the source of an item; the quantity and the unit come from the sheet's total and are locked.
- Progress Payments — the quantity of items on a take-off agreement ends up there; this page is the document showing where that figure came from.
- Subcontractors — the subcontractor list in the details strip comes from there.
- Production Report — reads the status of the items on site; this page holds their quantity calculation.