
Production Planning
Production Planning is the page that says when the work will be done. Production items defined in Site Data Entry are tied here to a subcontractor and to a date range;
1. What it is for
Production Planning is the page that says when the work will be done. Production items defined in Site Data Entry are tied here to a subcontractor and to a date range; the result is a schedule chart that runs from left to right.
A plan is a subcontractor carrying out specific production items within a specific date range. The length of the bar shows the duration, the fill inside it shows how much of that work is finished, and the arrows between bars show which job is waiting for which.
These are the questions the page answers: who has which job this week, which job has slipped, if I pull a job forward, where do the ones behind it move to and when does the programme finish. The schedule can be taken out as Excel, PDF and an AutoCAD drawing.
It is the only page in the app with a time axis. The other pages show a list; here the first axis is time and the second is the work.
2. Opening it, and who can see it
In the sidebar, Site Operations › Production Planning.
| Your permission | What you can do |
|---|---|
| View | You read the chart, filter it, zoom it and export it. The New plan and Folder buttons are not drawn; bars cannot be dragged and the right-click menu comes up empty |
| Edit | Everything above, plus adding plans, changing dates, creating links, and defining folders and non-working days |
| No permission | The module appears dimmed and locked in the menu |
3. The anatomy of the screen
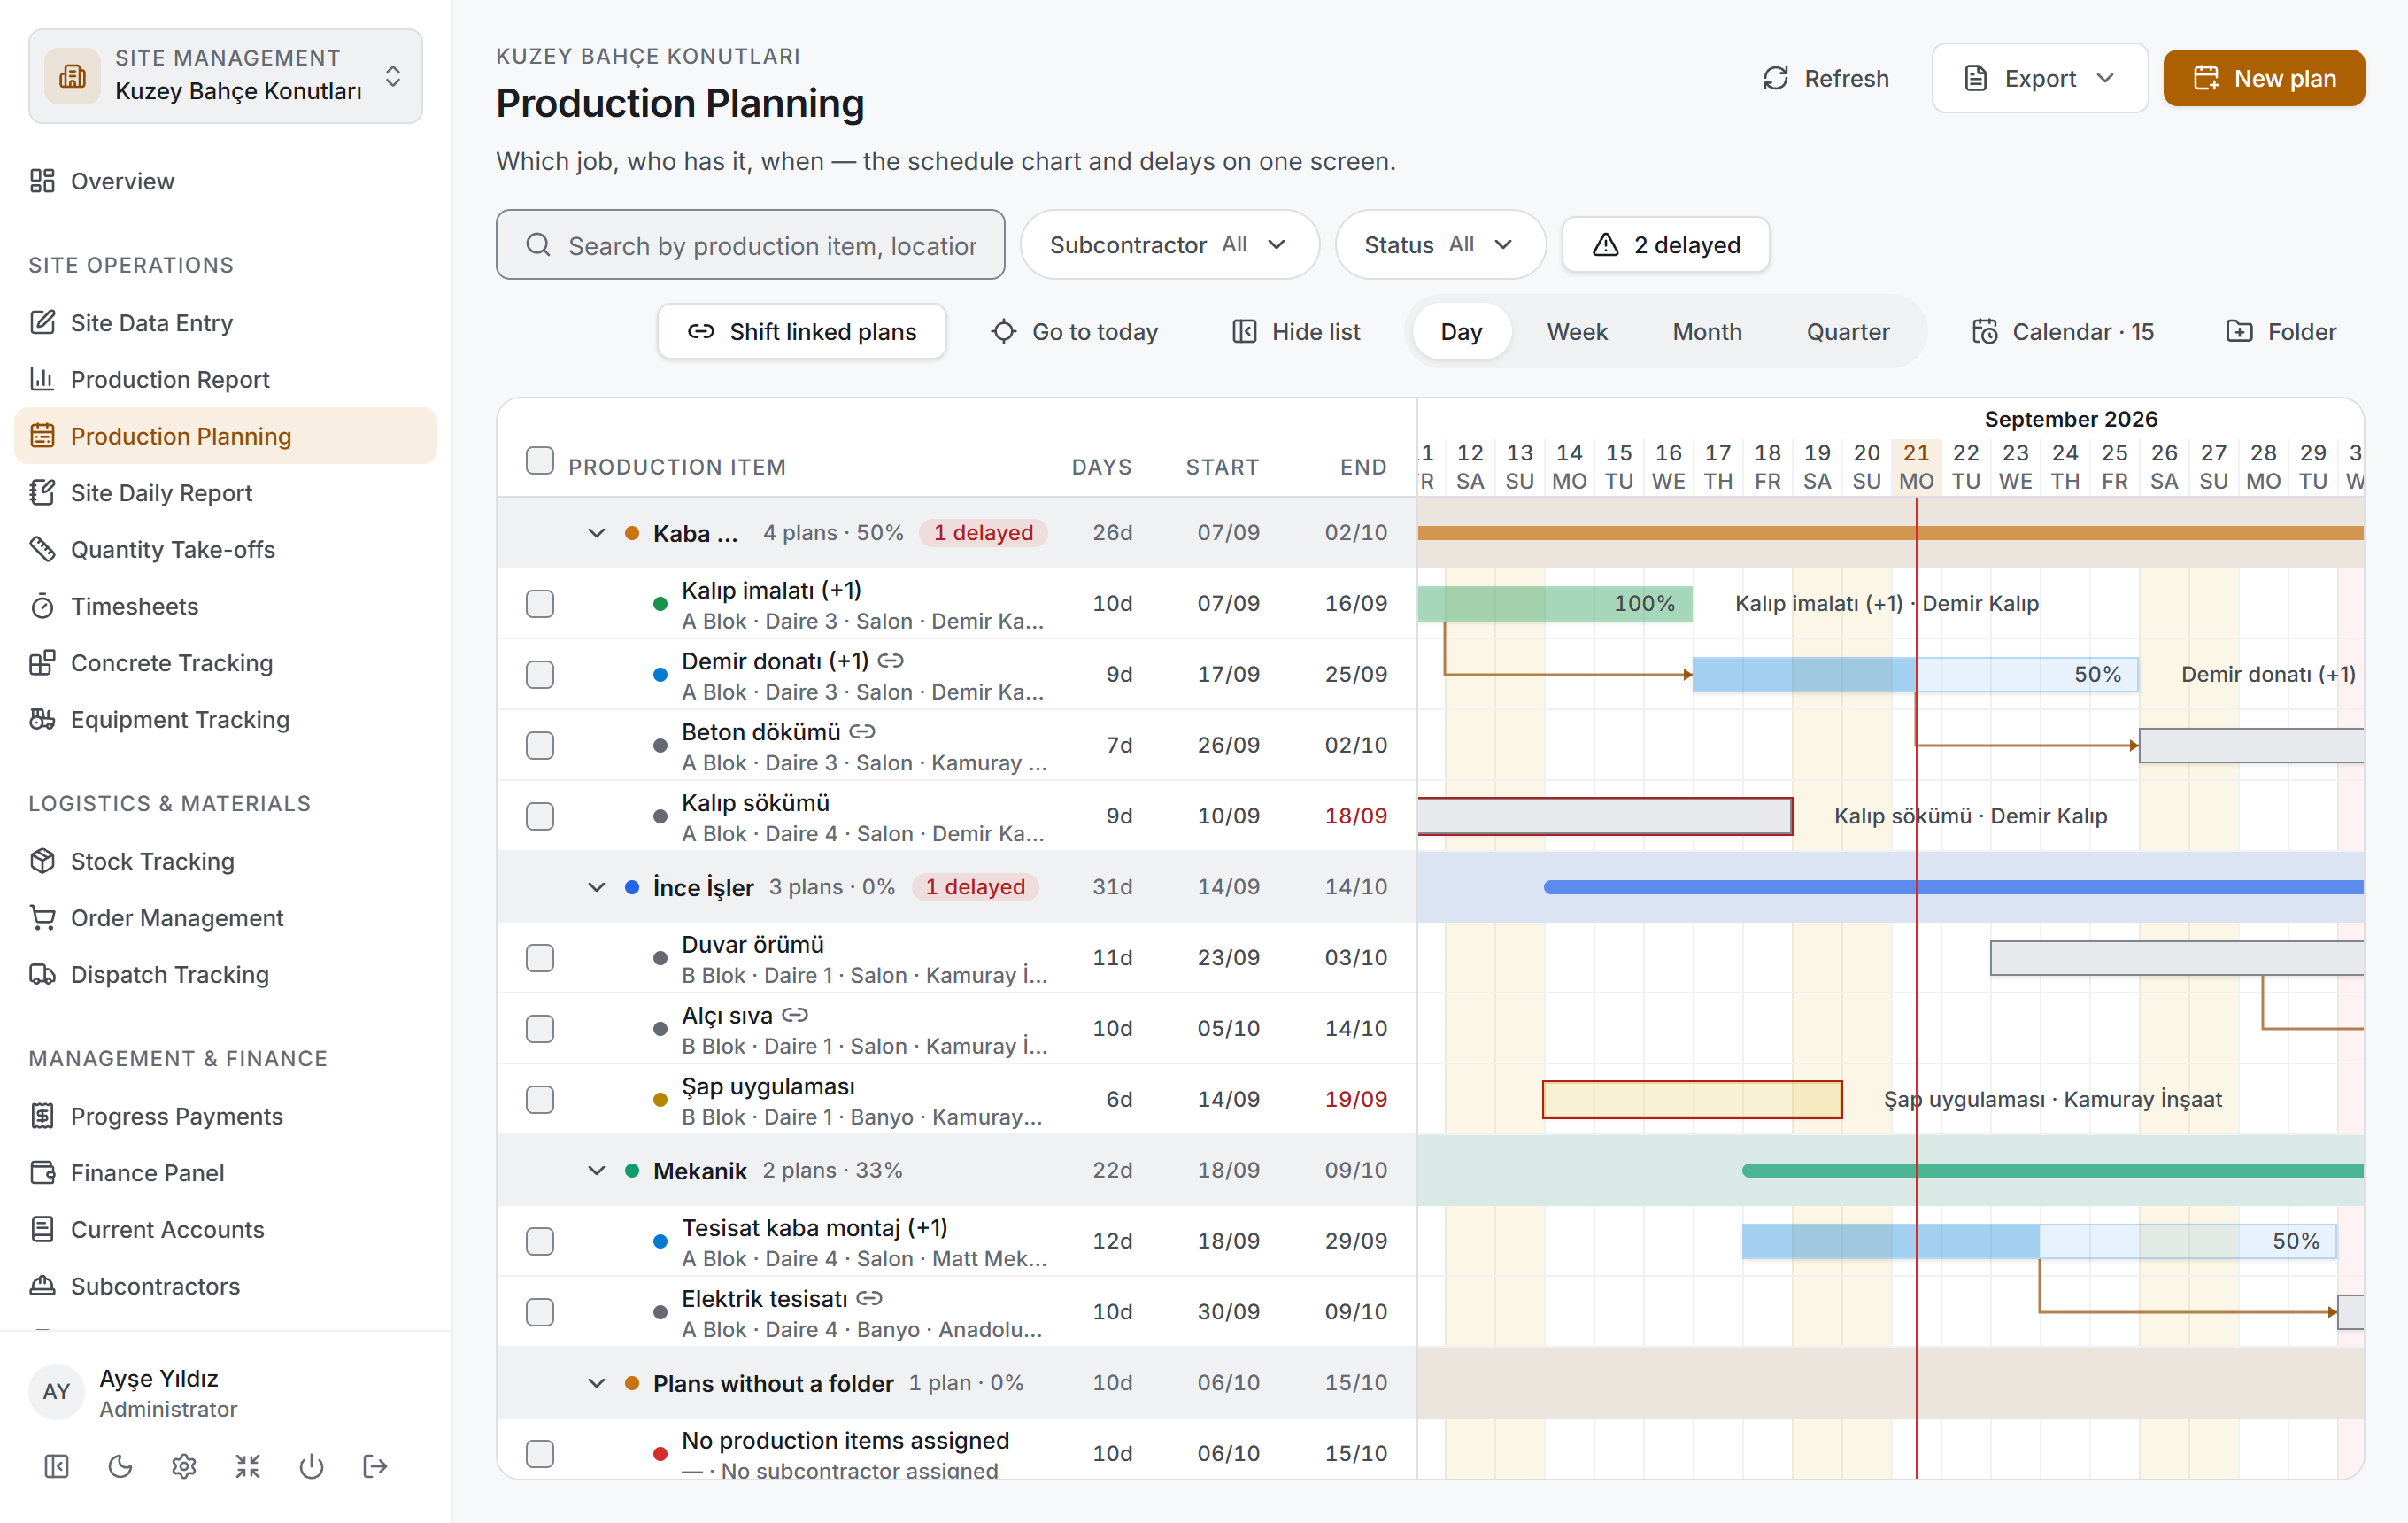
The page has three layers and the chart takes all the remaining height. There is no summary card above the chart: on a schedule chart the most valuable space on screen is the vertical space.
| Layer | What it does |
|---|---|
| Header | The page name, the project name and three actions: Refresh, Export, New plan |
| Toolbar | The buttons that decide what appears on the chart and how it appears |
| Chart | The job list on the left, the time axis on the right — inside a single scrolling area |
Header and buttons
The title is Production Planning, with the project name above it and "Which job, who has it, when — the schedule chart and delays on one screen." below.
| Button | What it does |
|---|---|
| Refresh | Reads the schedule from the server again. It says Refreshing while it runs |
| Export | Opens a menu with three choices: Download Excel, Download PDF (chart), Download DXF (AutoCAD). It says Preparing… while it runs |
| New plan | Opens the empty plan window |
The Export button is dimmed if the filter brings back no plans — the export of an empty schedule is an empty file. When a file is saved, a green strip appears under the header with the full path of the file; you close the strip yourself with Close.
The toolbar

The toolbar has two groups. The first group decides what appears on the chart:
| Item | What it does |
|---|---|
| Search plans | Searches the production item name, location, subcontractor, note and status name at once |
| Subcontractor | The subcontractors that have work in the schedule; each one shows how many plans it has |
| Status | Those of the five statuses that actually occur on screen |
| N delayed | Filters down to the delayed plans. It turns red while pressed |
The second group decides how the chart looks:
| Item | What it does |
|---|---|
| Shift linked plans | When on, later plans linked to a moved plan are shifted by the same number of days |
| Go to today | Scrolls the chart so that today's line is centred |
| Hide list | Closes the left list and gives the full width to the chart. Pressing it again says Show list |
| Time scale | Day · Week · Month · Quarter — four zoom levels |
| Calendar | Opens the non-working days window. If days are recorded it also writes the count: Calendar · 12 |
| Folder | Opens the new folder window |
In a wide window both groups fit on one line; in a narrow one the second group wraps to the line below. Their order never changes.
The left list
The list is a tree: folders and the plans under them. Plans that are in no folder are collected under Plans without a folder.
A plan row has two levels: the production item name on top, the location and the subcontractor below it. The coloured dot in front of the name is the status, and the chain mark next to it says Linked to a previous plan. On the right there are three number columns: DAYS, START, END. The end date is written in red on a delayed plan.
A folder row writes its own colour, its name, how many plans it holds and the total completion rate; if there is a delay inside it, a red number appears next to it. The columns on the right show the number of days the whole folder covers and its first and last date.
You can widen or narrow the list by dragging the thin separator between the list and the chart.
The chart
The right-hand side carries a two-line header and a background beneath it.
| Item | What it says |
|---|---|
| Upper header line | Month, quarter or week — depending on the scale |
| Lower header line | Day numbers (if the scale is wide enough) |
| Shaded columns | Non-working days. Hovering over one shows its description |
| Red vertical line | Today |
| Coloured band | The time range a folder covers |
| Bars | The plans |
A bar has square corners and takes its colour from the status. The lighter fill inside it shows the completion rate; if the bar is wide enough, the rate itself is written inside it. The production item name and the subcontractor are always written to the right of the bar — the position does not change however narrow the bar gets. The bar of a delayed plan carries a red frame.
The arrow between two bars says that the later one is linked to the earlier one. It leaves the predecessor from its bottom edge and enters the successor from the left.
The bar details card
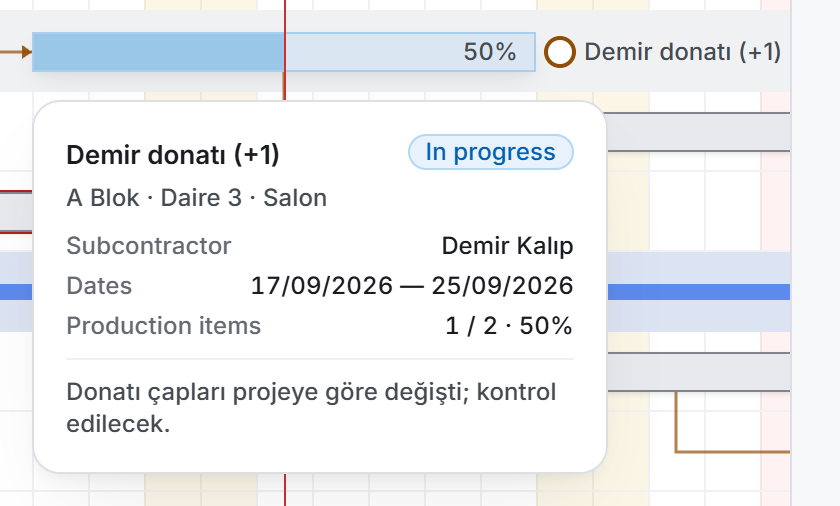
When you hover over a bar, a small card opens below it: the plan name, the status badge, the location and four lines — Subcontractor, Dates, Production items, and Delay if there is one. If the plan has a note it appears at the bottom of the card. The card is there so that you can read it without leaving the chart.
4. Fields
The fields in the plan window
| Field | What it means | Required |
|---|---|---|
| Subcontractor | The company that will do the work. It comes from Subcontractors | Yes |
| Status | Planned · In progress · Postponed · Completed · Cancelled | No, the default is Planned |
| Folder | Which heading the plan will sit under in the list | No |
| Start | The first day of the bar | Yes |
| End | The last day of the bar. Above the box it says how many calendar days the plan comes to | Yes |
| Previous plan | The plan this one waits for. Selecting it draws an arrow on the chart | No |
| Production scope | The production items the plan covers. The completion rate is calculated from them | No, but with an empty scope the rate stays at 0% |
| Notes | Free text. It appears on the bar's details card | No |
The values read from the chart
| Value | How it is calculated |
|---|---|
| Days | The number of calendar days, start and end included. Non-working days are counted too |
| Completion | The share of the linked production items marked Done |
| Status | By the rule below; partly measured, partly read from the record |
| Delay | On plans whose end date has passed and that are still not finished, how many days have passed since the end date |
The status comes from two sources. If the record says Cancelled or Postponed, that is what stays — these are a decision, not a measurement. The other three are measured: if every production item in the scope is finished the status is Completed, if some of them are finished it is In progress, and if none of them are it is whatever the record says.
The non-working day fields
| Field | What it means |
|---|---|
| Date | The day that will not be worked |
| Type | Weekend · Public holiday · Site-specific |
| Description | Free text, shown when you hover over that day on the chart |
5. Step by step
5.1 Creating a plan
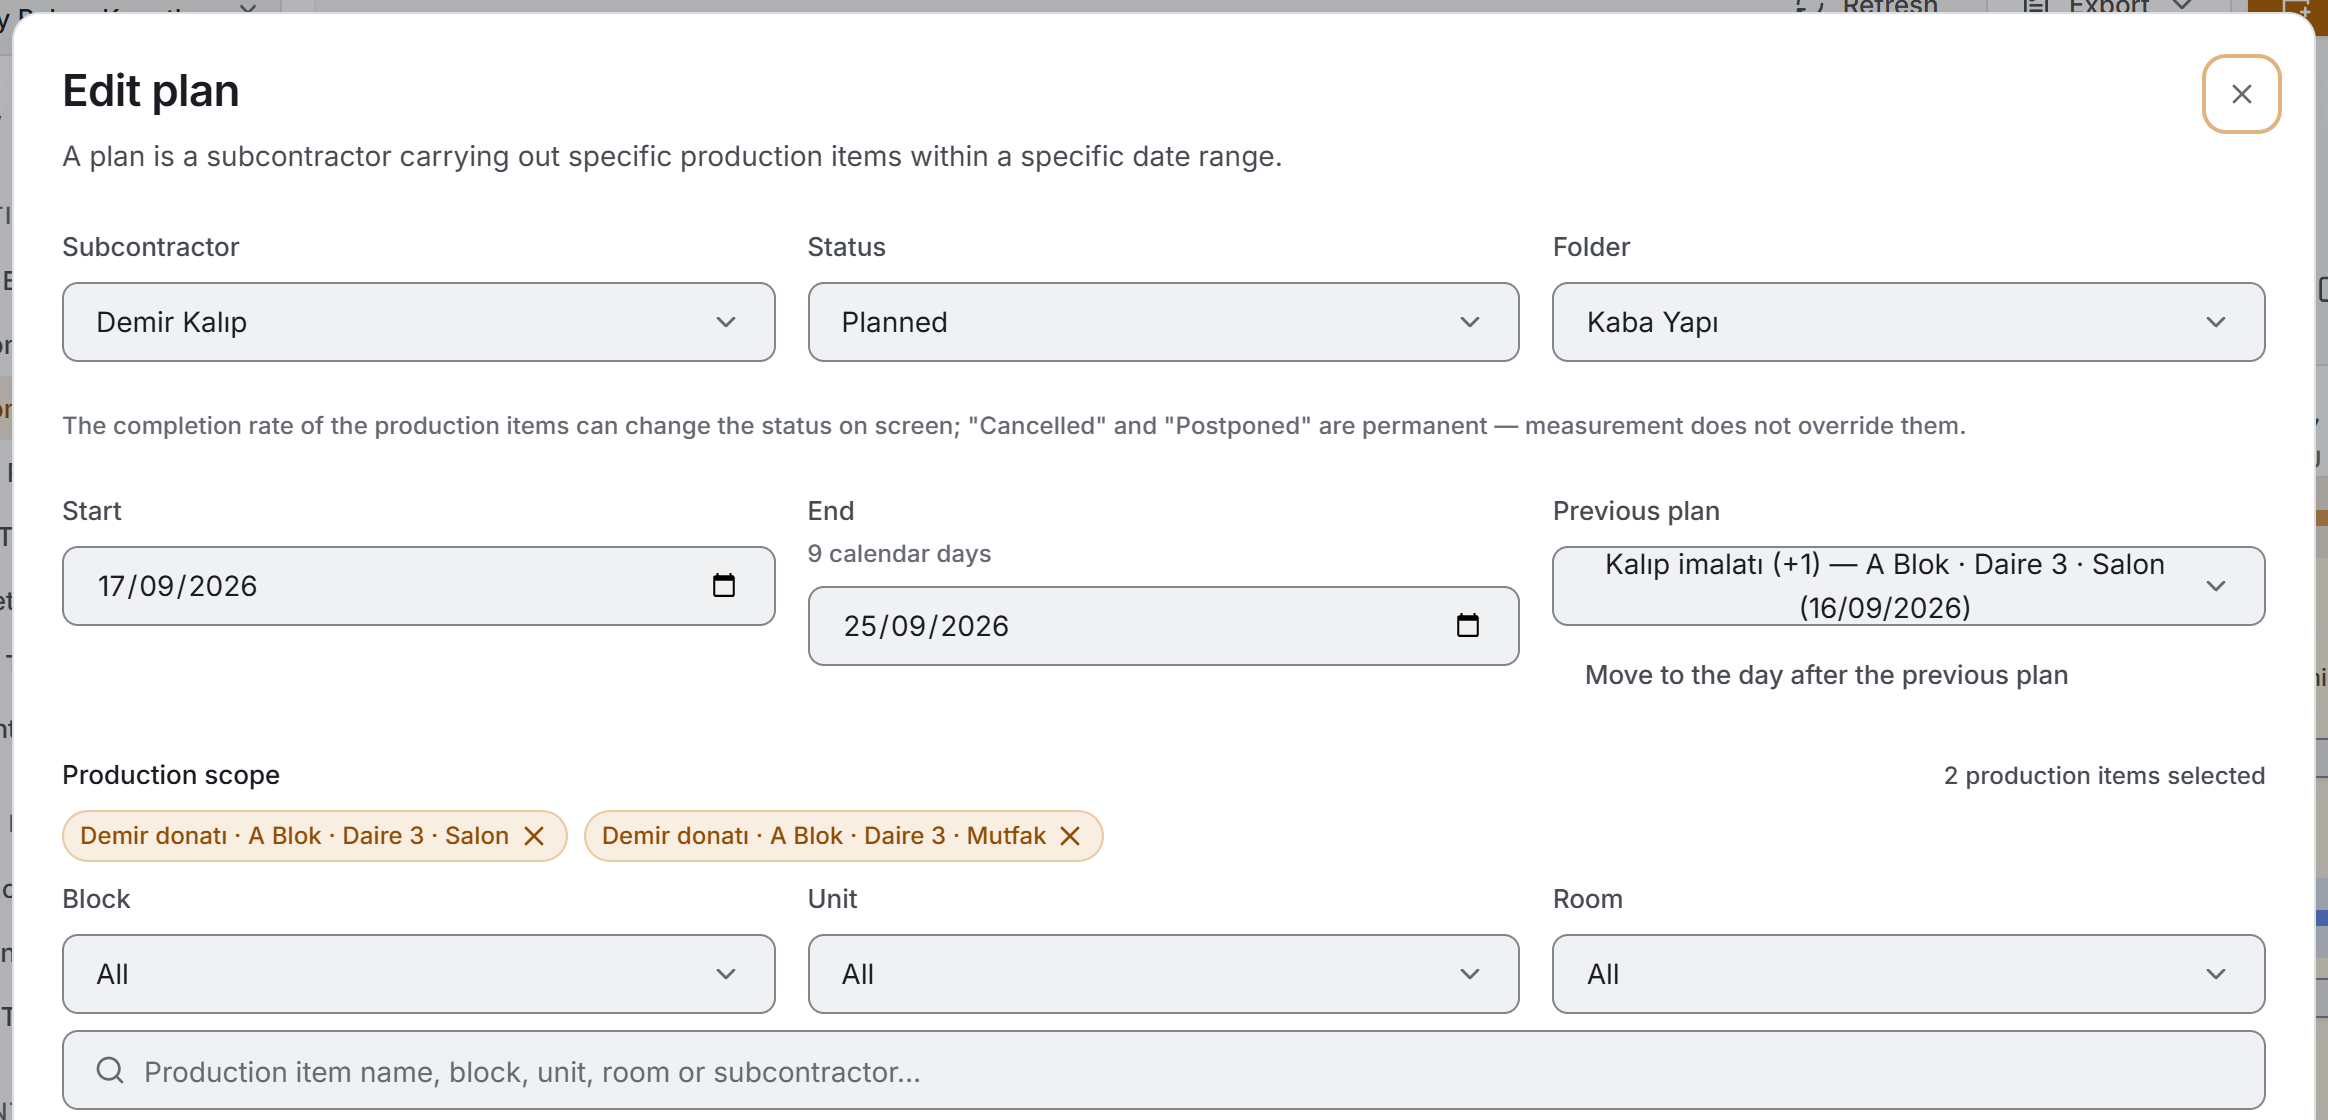
- Press New plan in the header. To add it straight into a folder, right-click that folder and choose New plan inside.
- Fill in Subcontractor, Start and End. When you pick the start date and the end is empty, the end is pulled to the same day; a one-day plan is the most common shape.
- Choose Status, Folder and Previous plan if you need them.
- Tick the production items the plan covers under Production scope.
- Write Notes if you want to, and press Create.
If a required field is empty, a warning appears at the top of the window: "Subcontractor, start date and end date are required." If the end date is before the start date a separate warning appears and nothing is saved.
5.2 Choosing the production scope
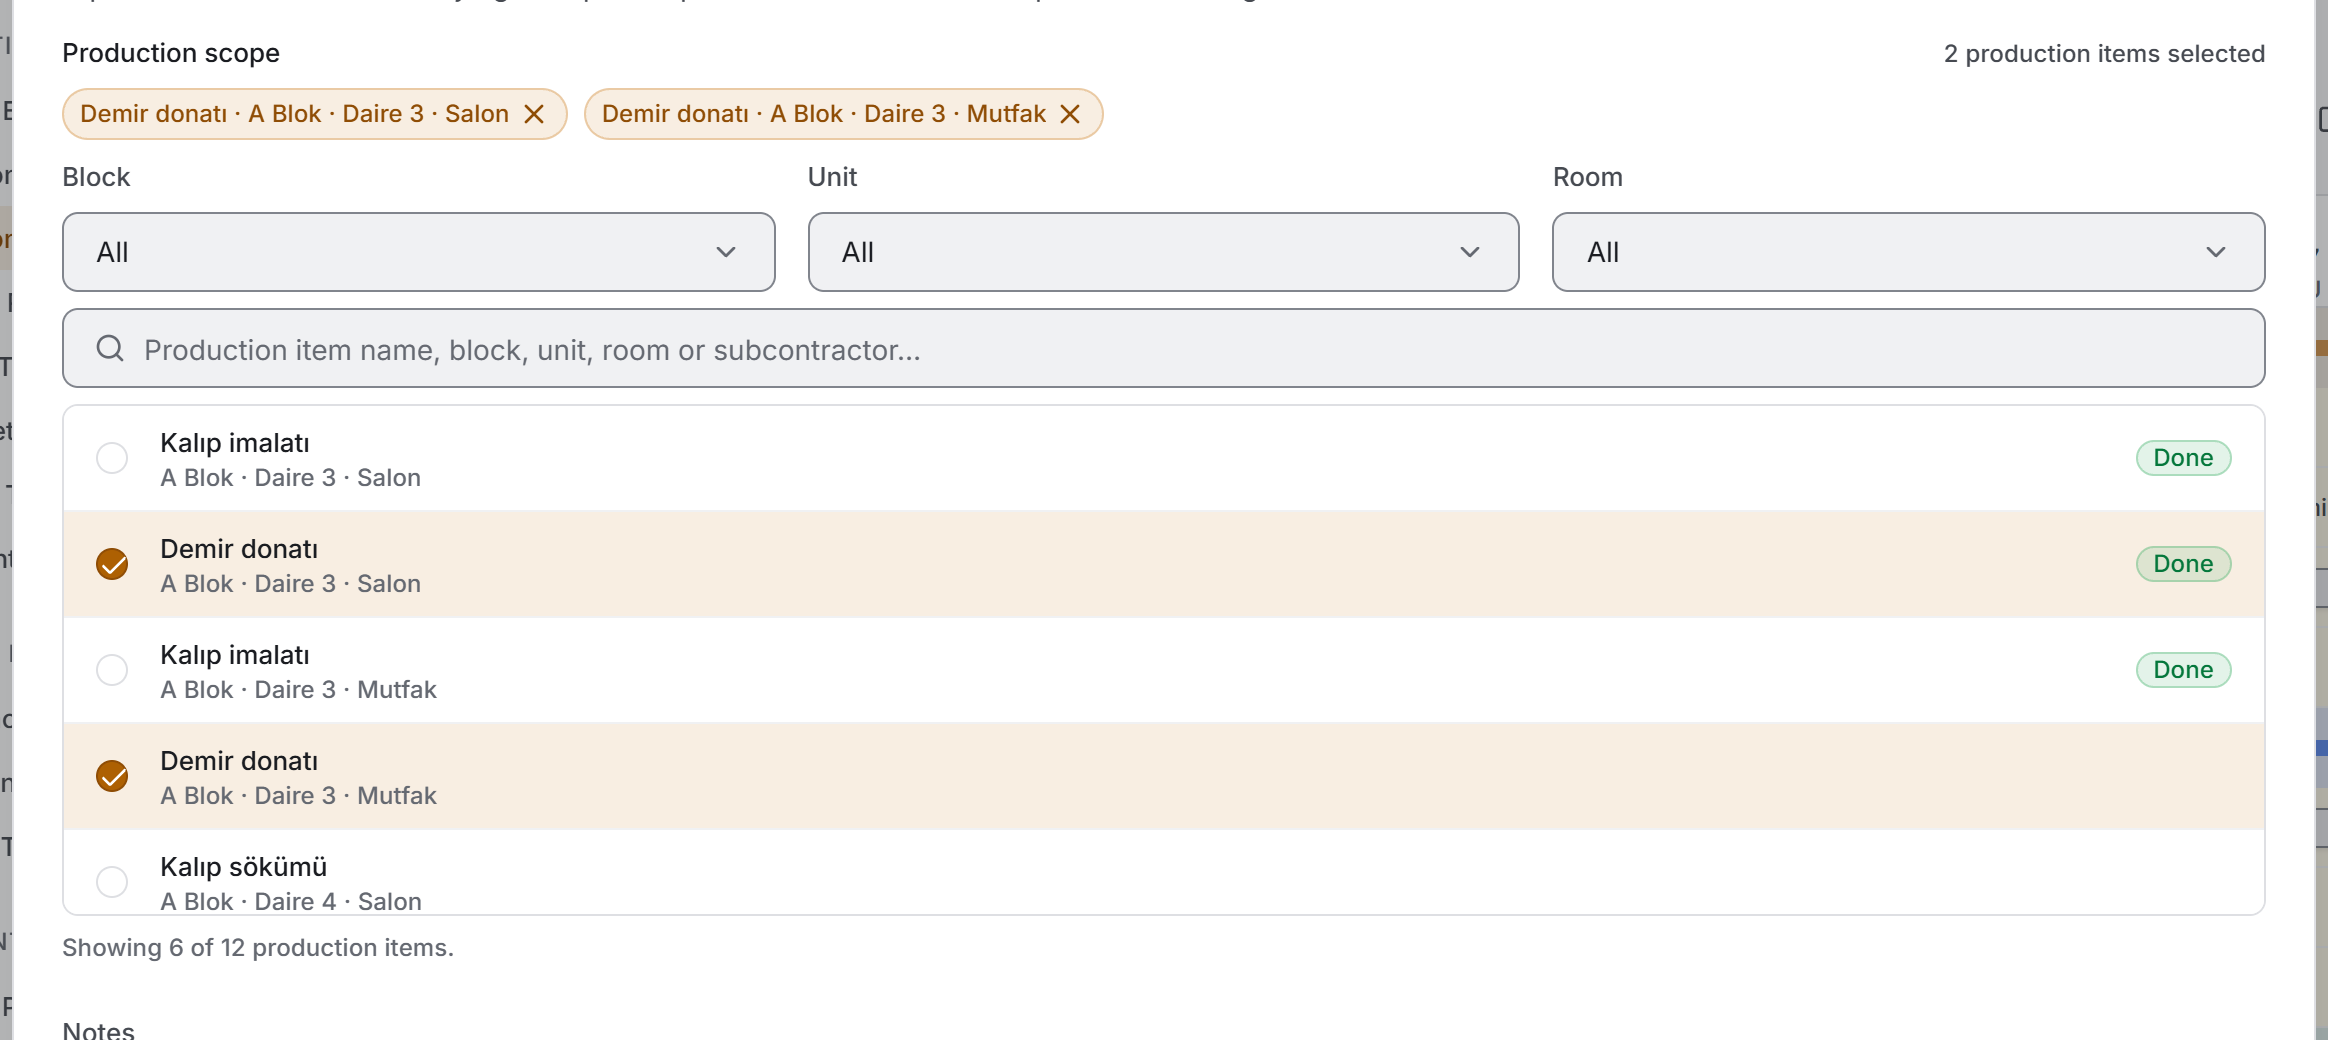
A project can hold thousands of production items; the window narrows the list in three stages.
- Fill in the Subcontractor box at the top of the window — the plan's subcontractor also narrows this list. It comes down to the production items assigned to that subcontractor and those that have no subcontractor yet; work assigned to another subcontractor drops out.
- Narrow the location with the Block, Unit and Room boxes. All three are optional; when an upper level changes, the ones below it return to All.
- Type into the Search production items box. The search moves inside the narrowed pool.
- Tick an item by clicking its row. What you pick collects at the top of the list as removable chips; items already finished on site carry a Done badge.
The line under the list says how many production items are shown. If the pool holds more than 300 records, only the first 300 are drawn and you are asked to narrow it down; as the filters do their work, that warning disappears on its own.
When the pool empties, the list says "No production items for the selected subcontractor and location. Loosen the filters." — that is, it says the problem is in the filters, not in the search.
5.3 Changing dates from the chart
There is no need to open a window; the bar itself carries three handles.
- Grab it by the body and drag — the plan moves forward or back without its duration changing.
- Pull its right edge — the end date changes and the start stays where it is.
- It is written when you let go. While you drag, the new date range appears next to the bar.
5.4 Linking two plans
- Hover over the predecessor bar. A small ring appears at its right end.
- Grab the ring and drag it onto the successor bar. A dashed line follows you while you drag, and a valid target is highlighted.
- Let go. The successor's Previous plan field is now the predecessor, and an arrow is drawn between the two bars.
To remove a link, right-click the successor plan and choose Remove link. The same link can also be made from the Previous plan box in the plan window; there you also get a Move to the day after the previous plan button, which shifts the start with one click.
5.5 Shifting the chain together
When Shift linked plans is on and you move a plan, the later plans linked to it are shifted by the same number of days. When it is done the screen says "3 linked plans were also shifted."
When it is off, only the plan you are holding moves; the arrows stay where they are and the overlap becomes visible on screen.
5.6 Moving around the chart
| What you want | How |
|---|---|
| To zoom | Ctrl + mouse wheel, or the Time scale on the toolbar |
| To move sideways | Alt + wheel or Shift + wheel |
| To drag freely | Hold the middle mouse button and drag |
| To come back to today | Go to today |
| To give the chart the full width | Hide list |
While you zoom with Ctrl, the day under the pointer stays where it is; moving between two levels does not drop you somewhere else in the schedule.
5.7 Organising with folders
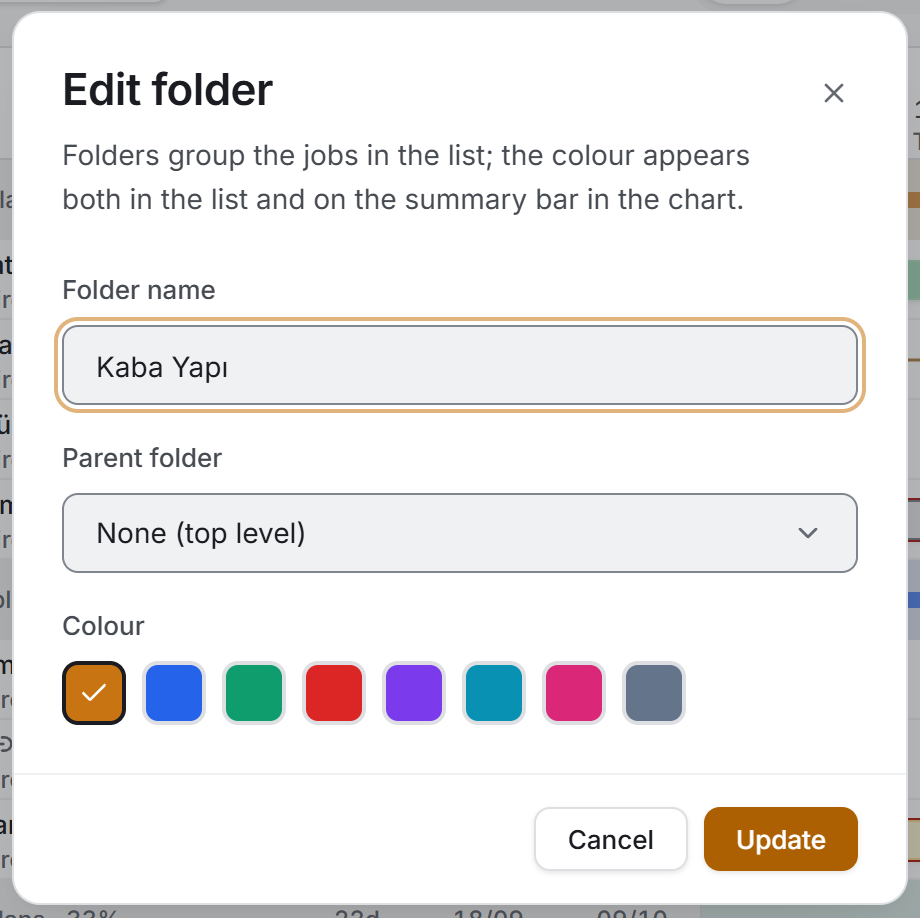
Folders group the jobs in the schedule — Structural work, Finishes, Mechanical and so on.
- Press the Folder button on the toolbar; to put it under another folder, right-click that folder and choose New subfolder inside.
- Write a Folder name, choose a Parent folder if you need one, and pick one of the eight colours.
- Press Create.
The colour appears both as the dot in the list and as the band on the chart. To move a plan into another folder, grab its row in the list and drag it onto the target; as you move it to the right the row indents and shows you in advance where it will land.
5.8 Defining non-working days
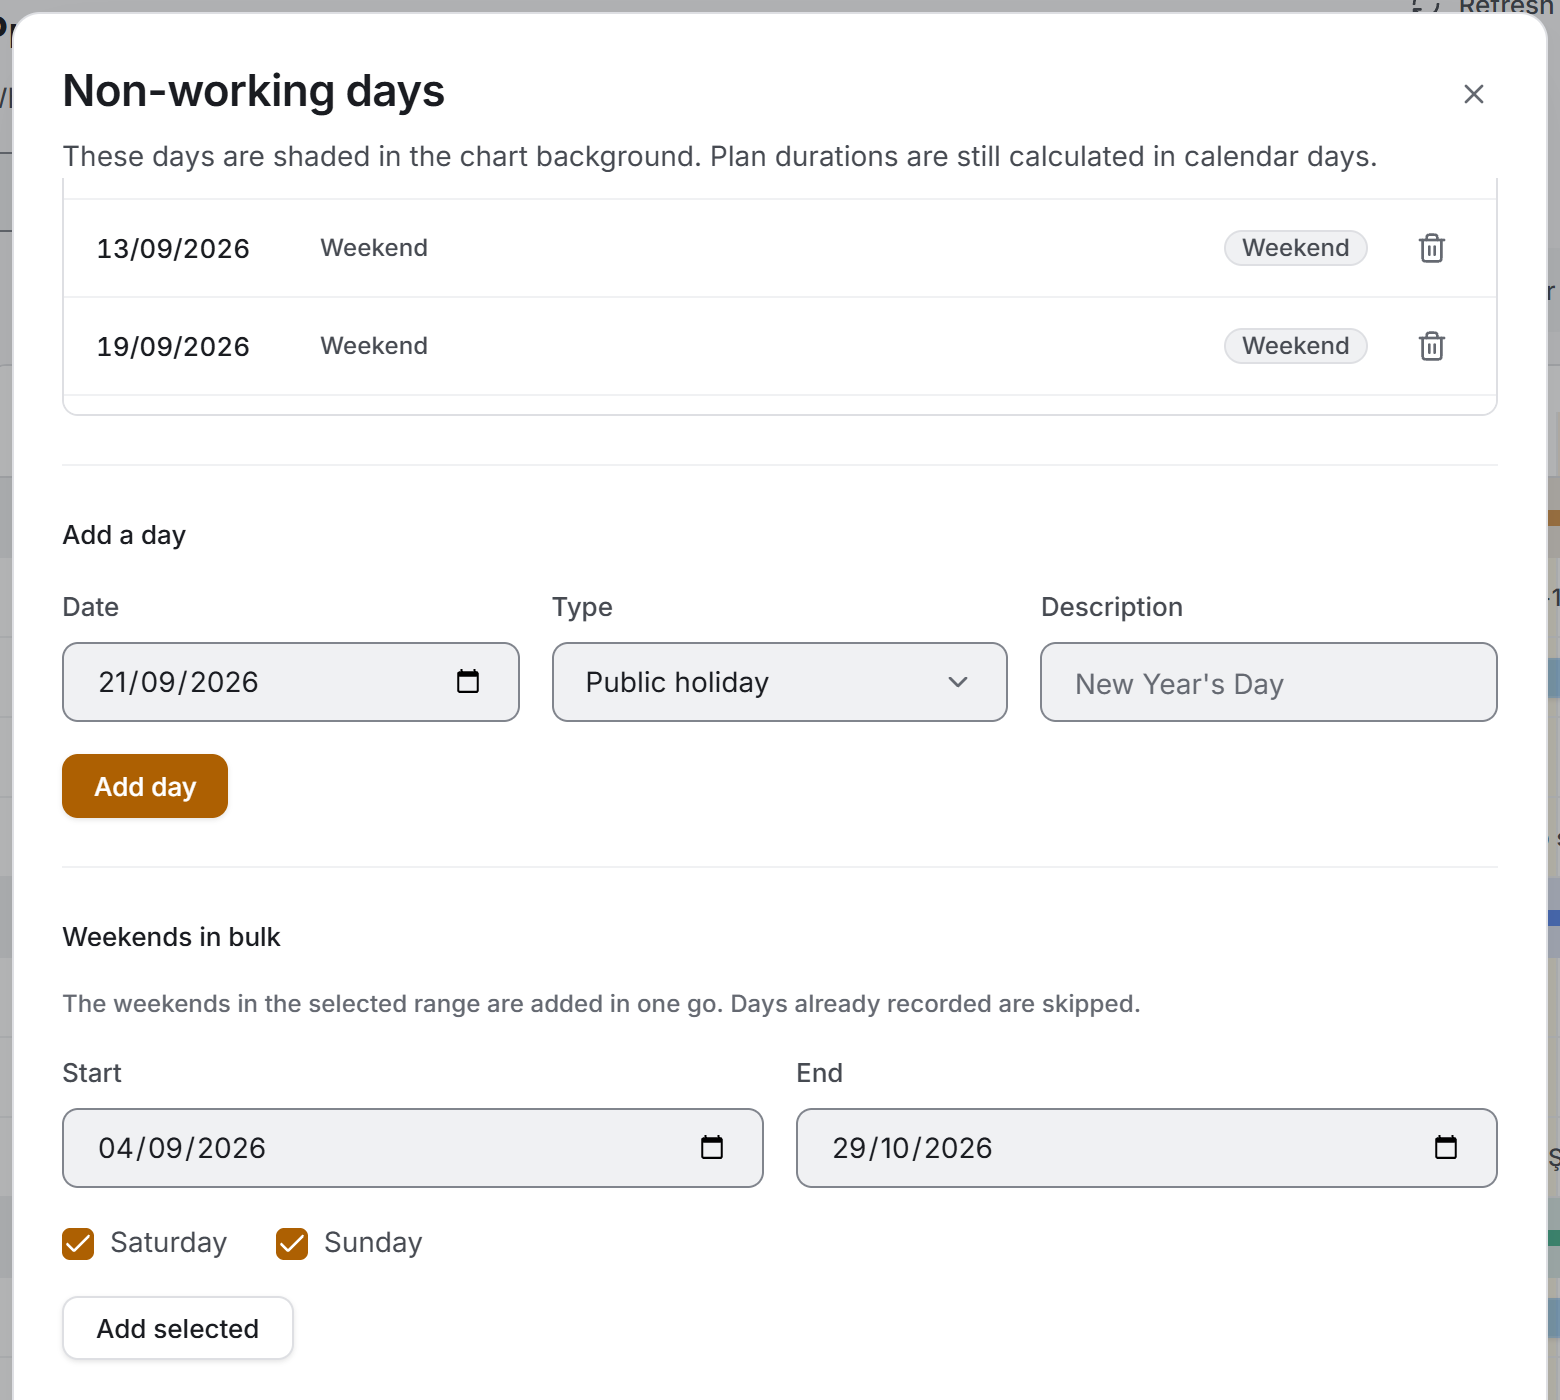
- Press the Calendar button on the toolbar.
- In the Add a day section pick the date, mark the Type and write a description if you want to — New Year's Day, for instance. Press Add day.
- Instead of entering weekends one by one, use the Weekends in bulk section. The date range comes ready with the chart's current range; tick Saturday and Sunday as you need and press Add selected. When it is done it says how many days were added.
The recorded days are listed in the upper half of the window; the bin at the end of each row deletes that day.
5.9 Deleting a plan
- Right-click the plan and choose Delete.
- The window that opens says what will happen: the production records linked to the plan stay on the server and only lose their place in this schedule; the links from later plans that follow this one are broken.
- Press Delete.
5.10 Deleting several plans at once
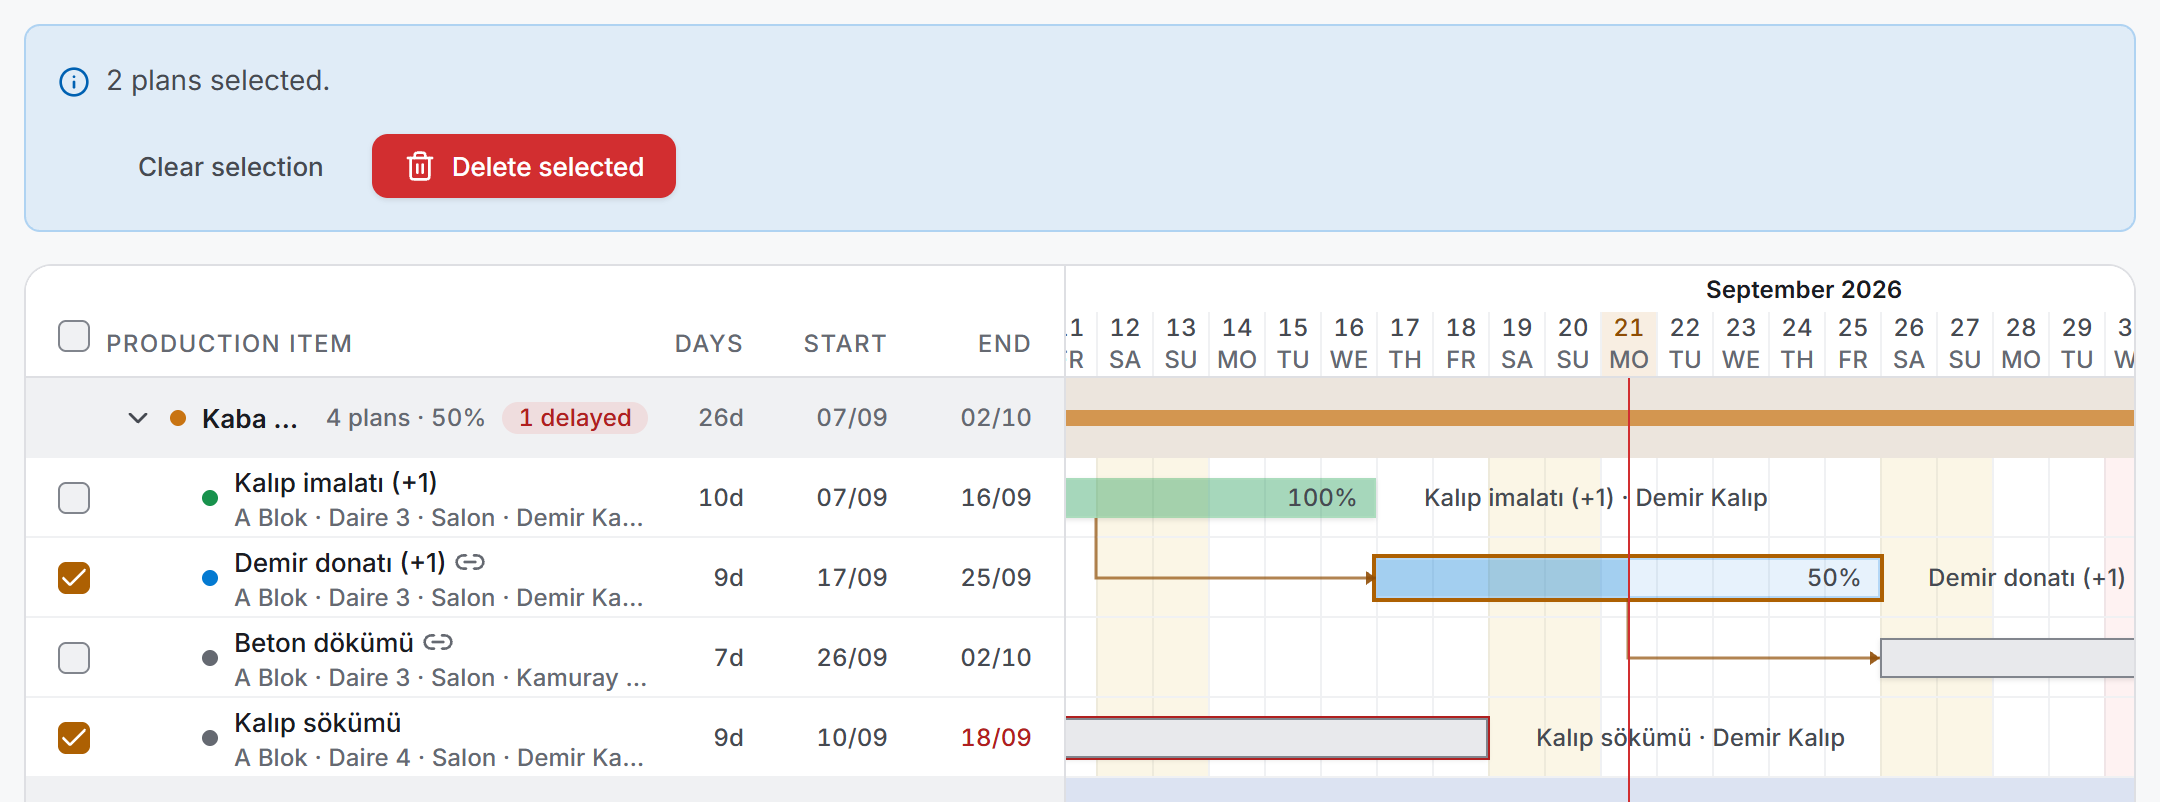
- Tick the boxes at the start of the plan rows in the list. The box in the header selects every visible plan. Ctrl + click flips a single record and Shift + click adds the rows in between; both also work on the bars.
- A strip appears saying "7 plans selected."
- Press Delete selected and confirm. The window writes the names of the first five plans and collects the rest as "… and 3 more plans."
When it is finished it says how many were deleted. If some of them could not be deleted that is said too, and the ones that failed stay selected, so you do not have to tick them again to try once more.
6. Exports
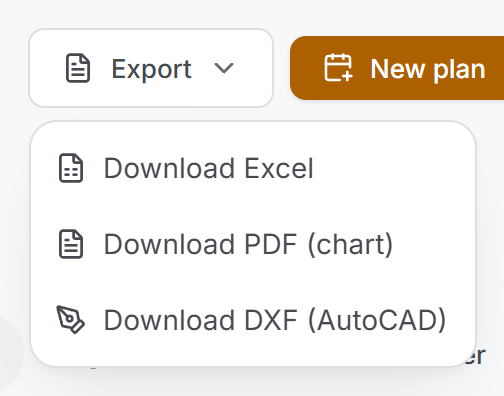
All three exports write the filter that is on screen. When you press the button the Windows save window opens; the file name comes ready as Production_Schedule_… with a date stamp at the end. If you press Cancel nothing is written.
Excel
A workbook with three sheets:
| Sheet | What is in it |
|---|---|
| Schedule | The plan rows, together with their folder |
| Subcontractor Load | Who has how many plans, how many days, how many are delayed, and the completion rate |
| Non-working Days | The calendar records: date, type, description |
The columns of the Schedule sheet are: Folder · Production item · Location · Subcontractor · Status · Start · End · Days · Production items · Completed · Rate % · Delay (days) · Previous plan · Note.
Each sheet opens with the project name, the date and the filter that was applied. The header row is frozen and carries an auto-filter. Numbers are written as real numbers and dates as real dates; whoever opens the file can build their own calculation.
A landscape A4 document, and what is inside it is the chart itself — a drawing, not a table.
- The top of the first page carries PRODUCTION SCHEDULE, the project name and the date it was prepared. The strip below writes the schedule range, the number of plans, and the numbers in progress, delayed and completed.
- The left column carries the PRODUCTION ITEM / FOLDER details, and the bar of that row is drawn to its right. The time axis is fitted to the width of the page.
- The day lines, day numbers, non-working day shading, dependency arrows, completion fill and delay marks are the same as on screen.
- A dashed red line marks the day the document was prepared.
- The chart is followed by the Subcontractor load table, and notes at the very end.
- The bottom of every page carries the project name, the document name and the filter applied.
If the scale becomes too narrow, the day lines and day numbers are not drawn; a squeezed grid would turn into an unreadable grey block.
DXF (AutoCAD)
The CAD drawing of the schedule. The same chart, written out in layers:
| Layer | What is in it |
|---|---|
0-FRAME | The frame and the header grid |
0-DAY · 0-HOLIDAY | Day lines and non-working day columns |
1-TEXT | Production item names, rates, dates |
2-FOLDER | Folder bands |
3-TODAY | Today's line |
4-LINK | Dependency arrows |
BAR-… | The bars, five separate layers by status |
The layers are there so that you can switch off what you do not want when you bring the drawing into your own sheet: if the day grid is too busy, 0-DAY is turned off and the chart itself stays.
The long schedule warning
If more than 400 rows go into the chart, the PDF asks first: "The schedule is very long." The window says how many rows will be printed and that the window may not respond for a few seconds while it is prepared. To carry on, press Prepare anyway.
7. Things worth knowing
The duration is in calendar days. Non-working days are shaded in the background of the chart but do not affect the duration. A five-day job that runs across a Sunday is still five days. This is a deliberate decision: the definition of a "working day" changes from site to site, and a schedule whose day count did not match the difference between two dates on the calendar would create a bigger confusion.
The completion rate comes from Site Data Entry. For a plan's bar to fill, the production items in its scope have to be marked Done there. Nothing can be marked done from this page.
Cancelled and Postponed are not overwritten by measurement. Every other status is calculated from the production items in the scope, but these two stay as the record has them. A production item inside a cancelled plan being done on site does not turn the plan back into In progress.
A plan with no dates has no bar. Records that came from the old application, or whose dates were cleared, stay in the list, show a dash in the days column and appear nowhere on the chart. The notes line of the exports says how many such plans there are.
A delay is an alarm, not a status. Every plan whose end date has passed and that is still not completed counts as delayed; you do not have to select a status as well. Cancelled and Completed plans produce no delay.
Search and filter work together. The search box searches the production item name, location, subcontractor, note and status name at once, while the filter chips narrow the pool. When both are on, the result is the intersection of the two.
The rate inside a bar is not always written. When the bar stays narrow the rate is not written but the fill is still visible; to read the number, either zoom in or hover over the bar and look at the details card.
The schedule is a snapshot. The data comes down once when the page opens and does not refresh by itself while you work with the filters. If someone else has added a plan in the meantime, you have to press Refresh to see it.
The successors of a deleted plan are set free. Deleting first breaks the links of the records that point to that plan as their previous plan. That is why some arrows disappear after a deletion; what is lost is not the arrow but a link that no longer exists.
Fields left empty have a stand-in in the list. A plan with an empty scope appears as No production items assigned, a plan without a subcontractor as No subcontractor assigned, and plans that are in no folder under the heading Plans without a folder. None of the three is a real name; each stands in for a field that was not filled in.
The subcontractor name comes from Subcontractors. If a company has been deleted there, the plan shows Deleted subcontractor; if none was ever assigned, No subcontractor assigned. Both can be picked from the filter.
Bulk selection only covers what is visible. The box in the header selects the plans that match the filter on screen. Putting a record hidden by a filter into a delete list would mean deleting something you cannot see.
8. Related sections
- Site Data Entry — the production items a plan covers are defined there, and marked Done there. Whether the bars fill depends on it.
- Production Report — tells the status distribution of the same production items; this page spreads the same work across time.
- Subcontractors — the subcontractor list in the plan window and the Subcontractor Load sheet in the export are fed from there.
- Overview — reads the general progress of the project; the delay against the programme is here, the completion is there.
- Site Daily Report — writes how much of the planned work was actually done on site that day.