
Production Report
The Production Report is where every production item marked on site is read on a single screen. Each production item entered into a room in Site Data Entry becomes one row here, together…
1. What it is for
The Production Report is where every production item marked on site is read on a single screen. Each production item entered into a room in Site Data Entry becomes one row here, together with its status.
These are the questions the page answers: how much of the project is finished, which block has fallen behind, which subcontractor carries the most work and which production items are still waiting. The result can be taken out as Excel or PDF and carried into a meeting, a progress payment or an email.
This is not a page where data is entered. No production item is added, changed or deleted from here; the report only reads. If a correction is needed, you go back to Site Data Entry.
2. Opening it, and who can see it
In the sidebar, Site Operations › Production Report.
| Your permission | What you can do |
|---|---|
| View | You read the whole report, filter, search and sort it. The header carries only the Refresh button; Download PDF and Download Excel are not drawn at all |
| Edit | Everything above, plus exporting the report as Excel and PDF |
| No permission | The module appears dimmed and locked in the menu |
3. Anatomy of the screen
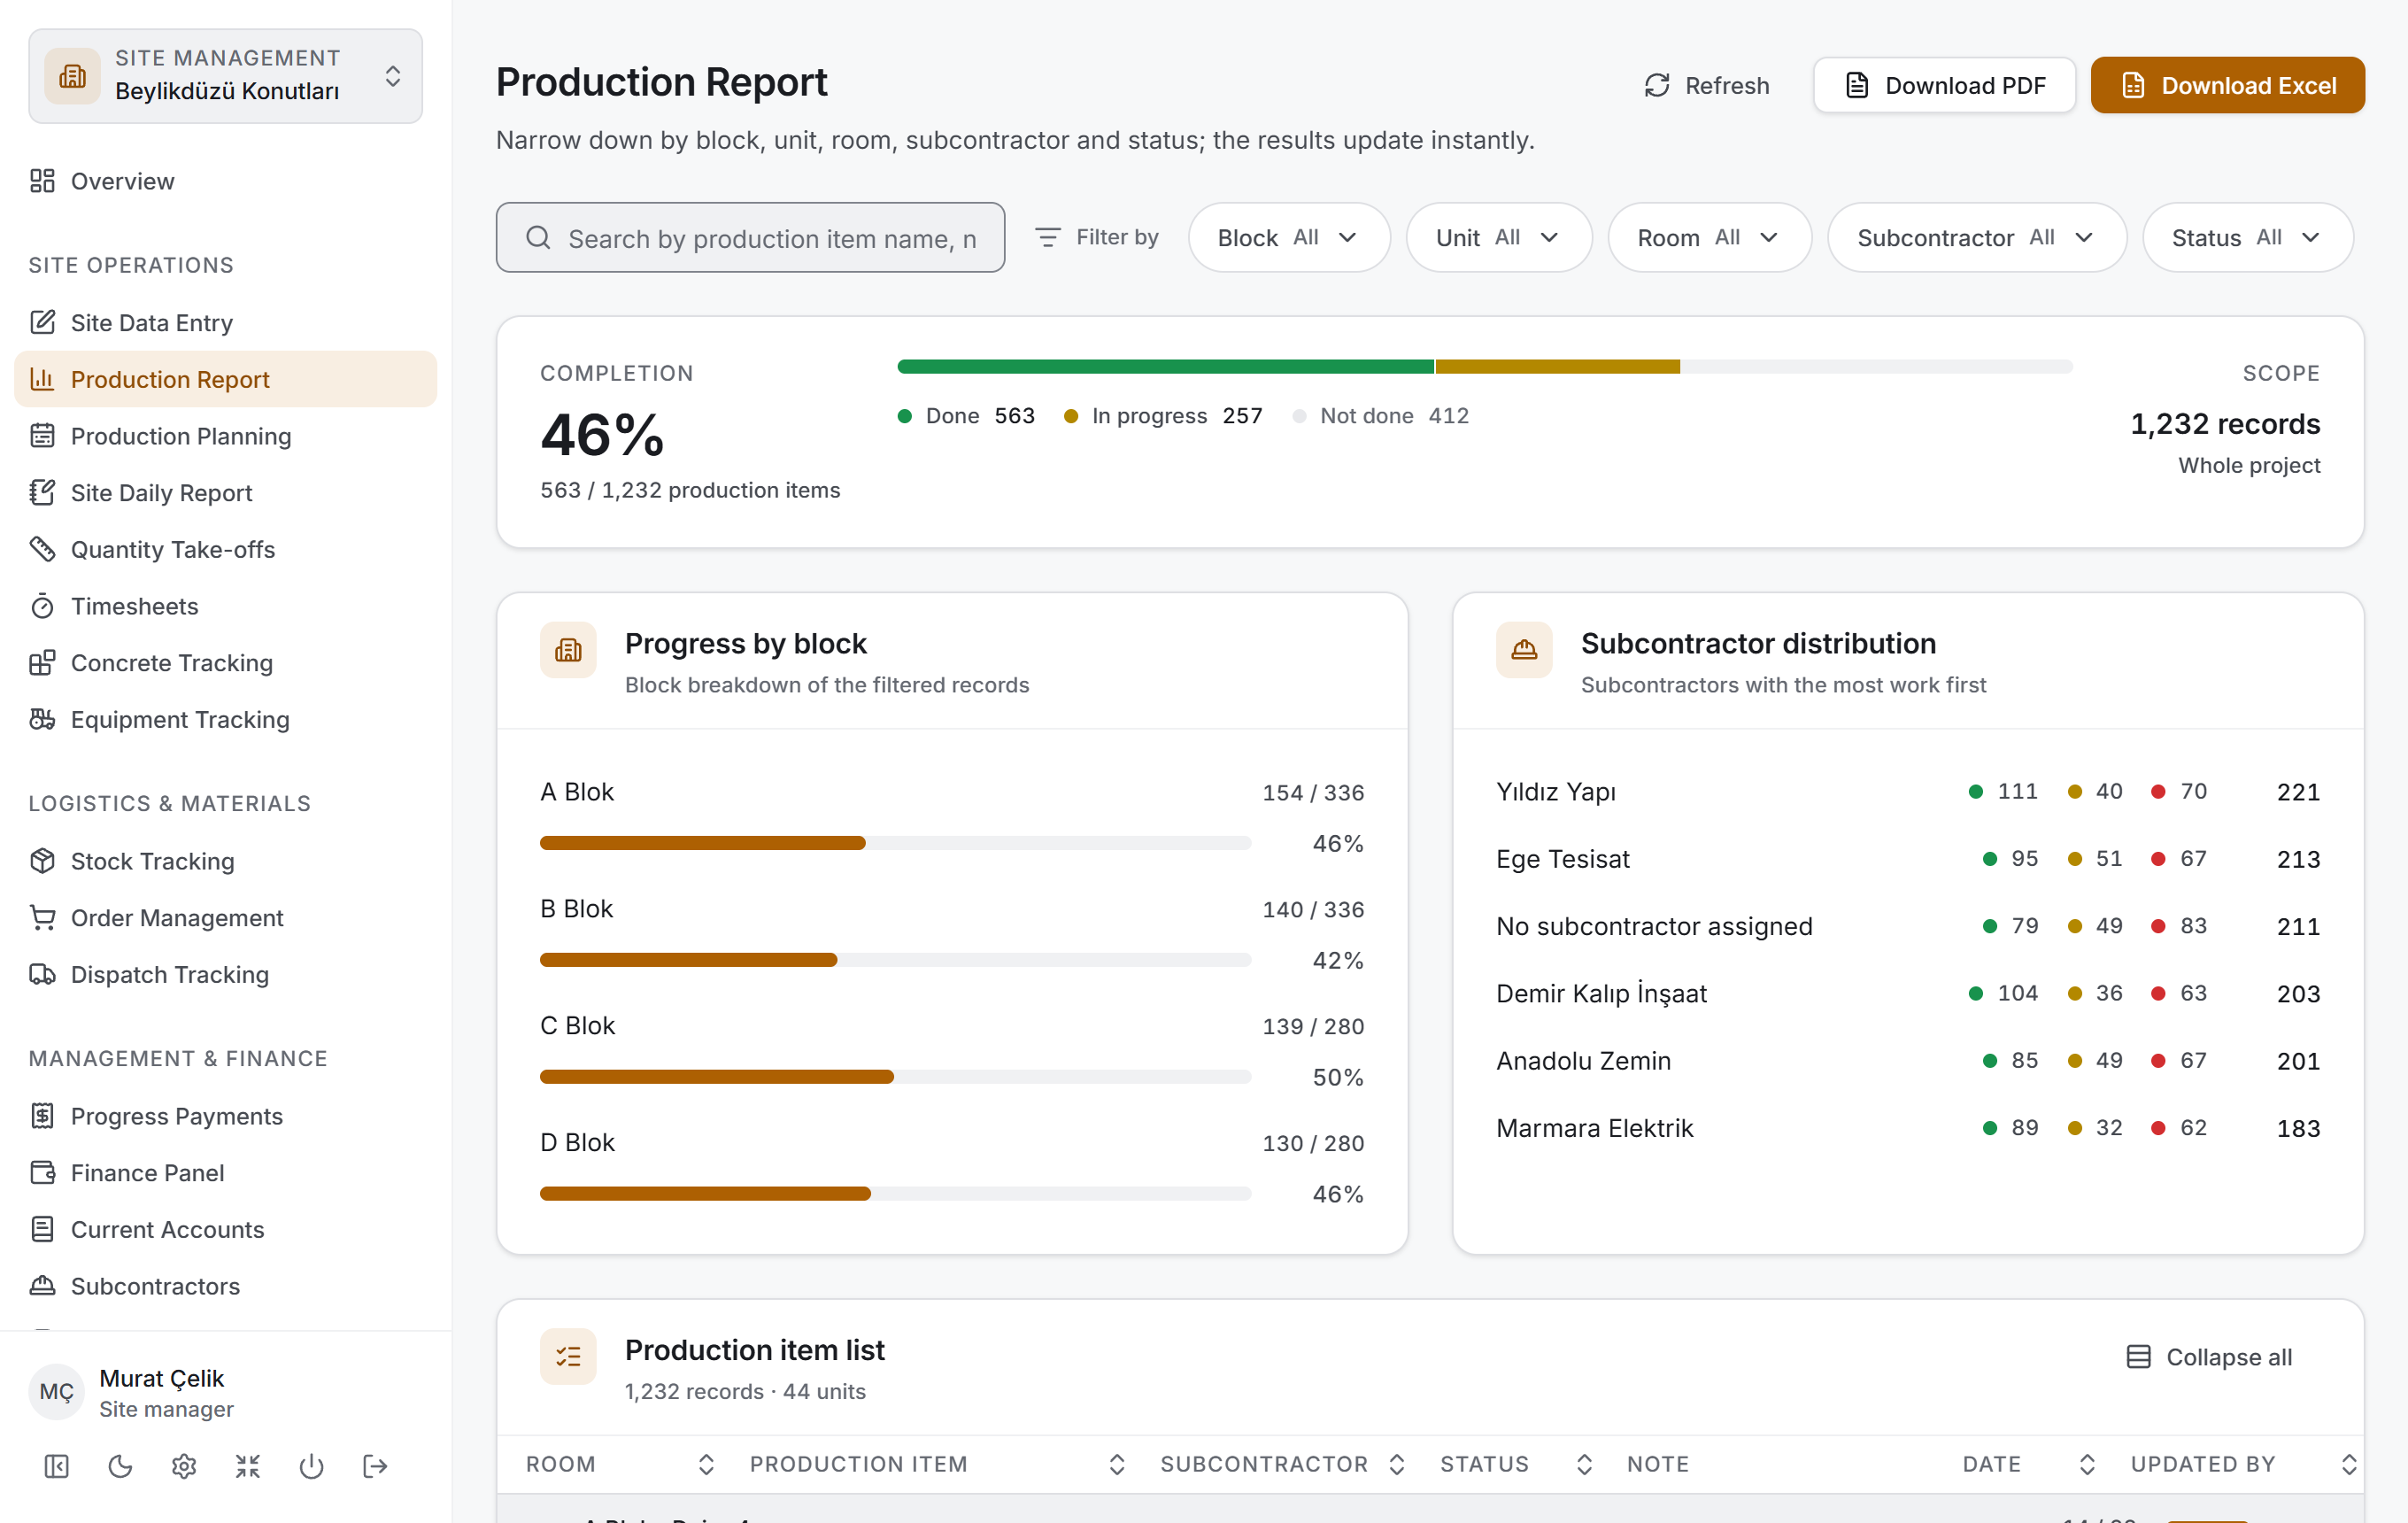
The page has three layers from top to bottom, and the order is deliberate: first you narrow down, then you read the result as figures, and only then you go down to the rows.
| Layer | What it does |
|---|---|
| Filter bar | The search box and five filter chips |
| Summary + breakdown | Completion percentage, status bar, block progress, subcontractor distribution |
| Table | The production item list, grouped by block and unit, collapsible |
Header and buttons
The title is Production Report, and the line below it reads "Narrow down by block, unit, room, subcontractor and status; the results update instantly." At most three buttons sit on the right:
| Button | What it does |
|---|---|
| Refresh | Reads the report from the server again. While it runs it says Refreshing |
| Download PDF | Saves the filter currently on screen as a PDF. While it runs it says Preparing PDF… |
| Download Excel | Saves the same filter as Excel. While it runs it says Preparing… |
The two export buttons are dimmed when the filter returns nothing — the export of an empty report is an empty file. While one is running the other waits.
When a file has been saved, a green bar appears under the header: "Report saved: …" followed by the full path of the file. The bar does not disappear by itself; you close it with Close. If you press Cancel in the save dialog nothing is written — changing your mind is not an error.
Filter bar

On the left the Search production items box, next to it the Filter by label and five chips: Block, Unit, Room, Subcontractor, Status. On a narrow window the chips wrap onto a second line; their order does not change.
Each chip shows what has been selected on it. If nothing is selected it says All; otherwise it shows how many are selected. So the chip can be read even while it is closed.
As soon as you make a selection or type in the search box, a clearing button appears to the right of the chips: Clear filters (N) if there are chip selections, Clear search if only a search term was typed. When the filter is empty the button is not drawn at all.
Filter menu
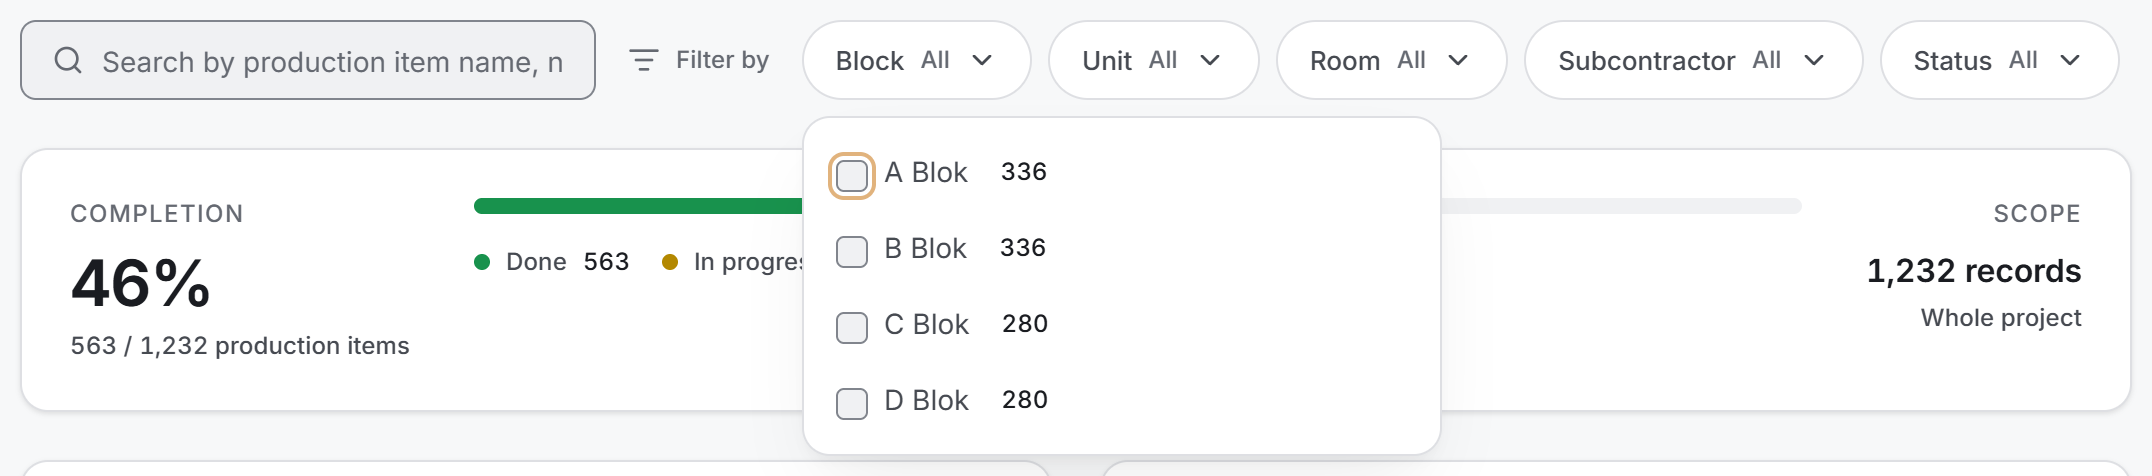
Pressing a chip opens a list underneath it. Next to each option is how many records it would bring — you see what the result will be before ticking the box.
If there are more than eight options, a search box appears above the list. Closing and reopening the menu clears that search.
When you make a selection a strip appears at the bottom of the menu: it says how many are selected and carries a Clear button next to it, which empties that chip's selections in one click.
The lists do not lock one another. The unit list is full even before a block is selected; when you select a block the list gets shorter and its figures change. The figures in a chip's own list are calculated from the selections on the other chips: if "A Blok" is selected and you see "B Blok · 96" in the block list, ticking that box will bring 96 more rows into the list.
Summary strip

The strip that states the result of the filter at a glance. It has three parts:
| Part | What it says |
|---|---|
| Left | COMPLETION — the large percentage, and "563 / 1,232 production items" below it |
| Middle | The status bar, with the name and count of each slice |
| Right | SCOPE — how many records, and how much of the project that is |
The bar is two slices and a remainder: the filled part is Done and In progress, the empty part is Not done. Work that has not started is not an alarm, it is the initial state of the work; that is why it gets no colour of its own.
The scope line on the right can say two things: if a filter is on, "128 of 205 records"; if the filter is empty, "Whole project."
Breakdown cards
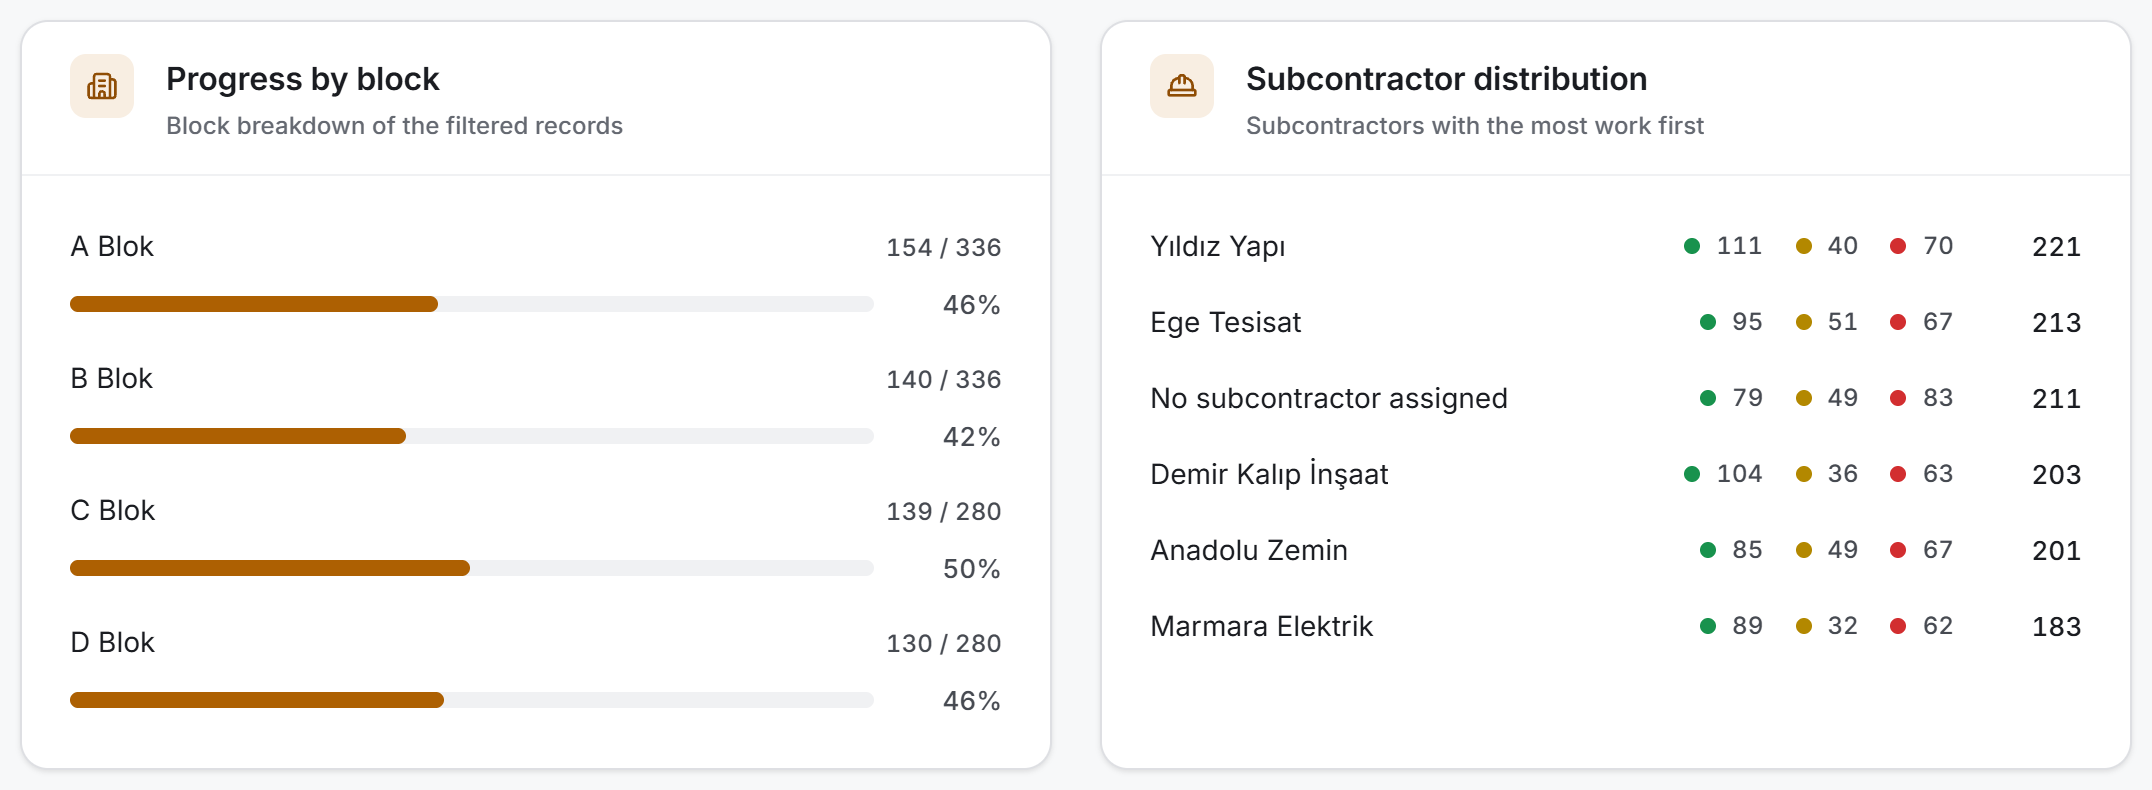
Two cards sit side by side below the summary strip, and they do not ask the same question.
Progress by block asks about a ratio: how much of each block is finished. Each line carries the block name, done / total on the right and a progress bar underneath. The order is the order you gave on site — it is not sorted by percentage, because a list that reorders itself on every filter change cannot be read.
Subcontractor distribution asks about a distribution: who carries the work. Each line carries the firm's name, the three status counts as coloured dots, and the total on the far right. This list is ordered so that the subcontractor with the most work is first. A status with a count of zero is not drawn on the line at all.
Both lists scroll inside their card; the cards do not grow and stretch the page.
If a card has nothing to show, a single sentence sits in its place: "No blocks to show" or "No subcontractors to show."
Table
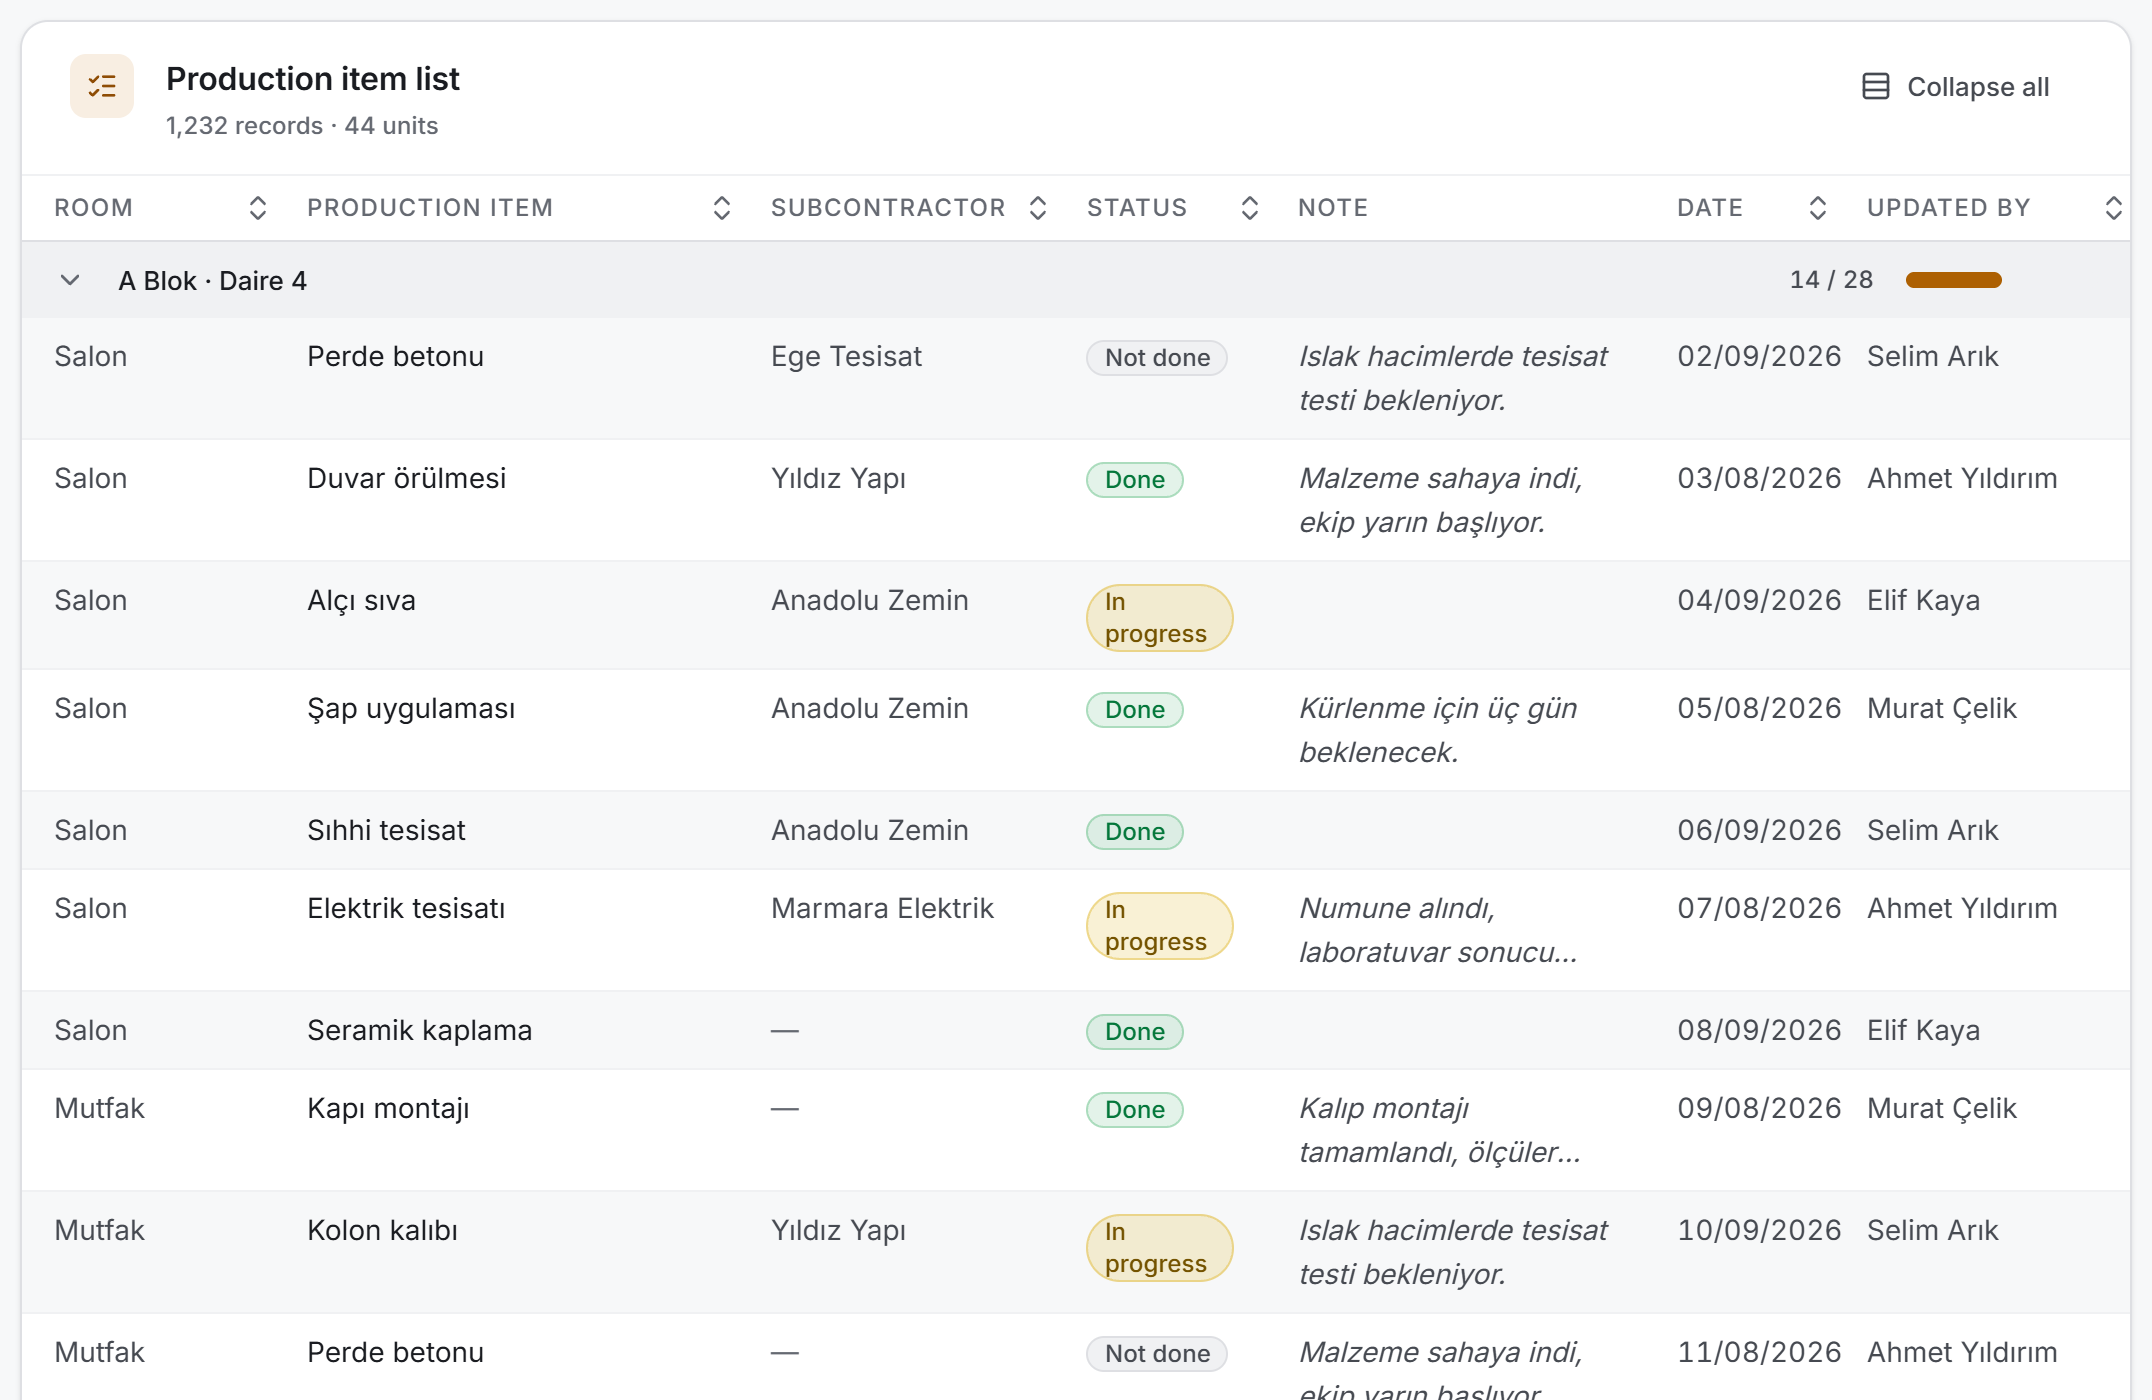
The real output of the page. The card is headed Production item list, with the number of records and units below it. On the right sits the Collapse all button; pressing it closes every group and renames the button to Expand all.
Rows are grouped by block and unit. The group heading carries both together (A Blok · Daire 12), with that group's done / total and a small progress bar to its right. Clicking the heading collapses and expands the group.
Because the group heading has taken over the repetition, seven columns remain in the table: Room · Production item · Subcontractor · Status · Note · Date · Updated by.
When the filter brings nothing
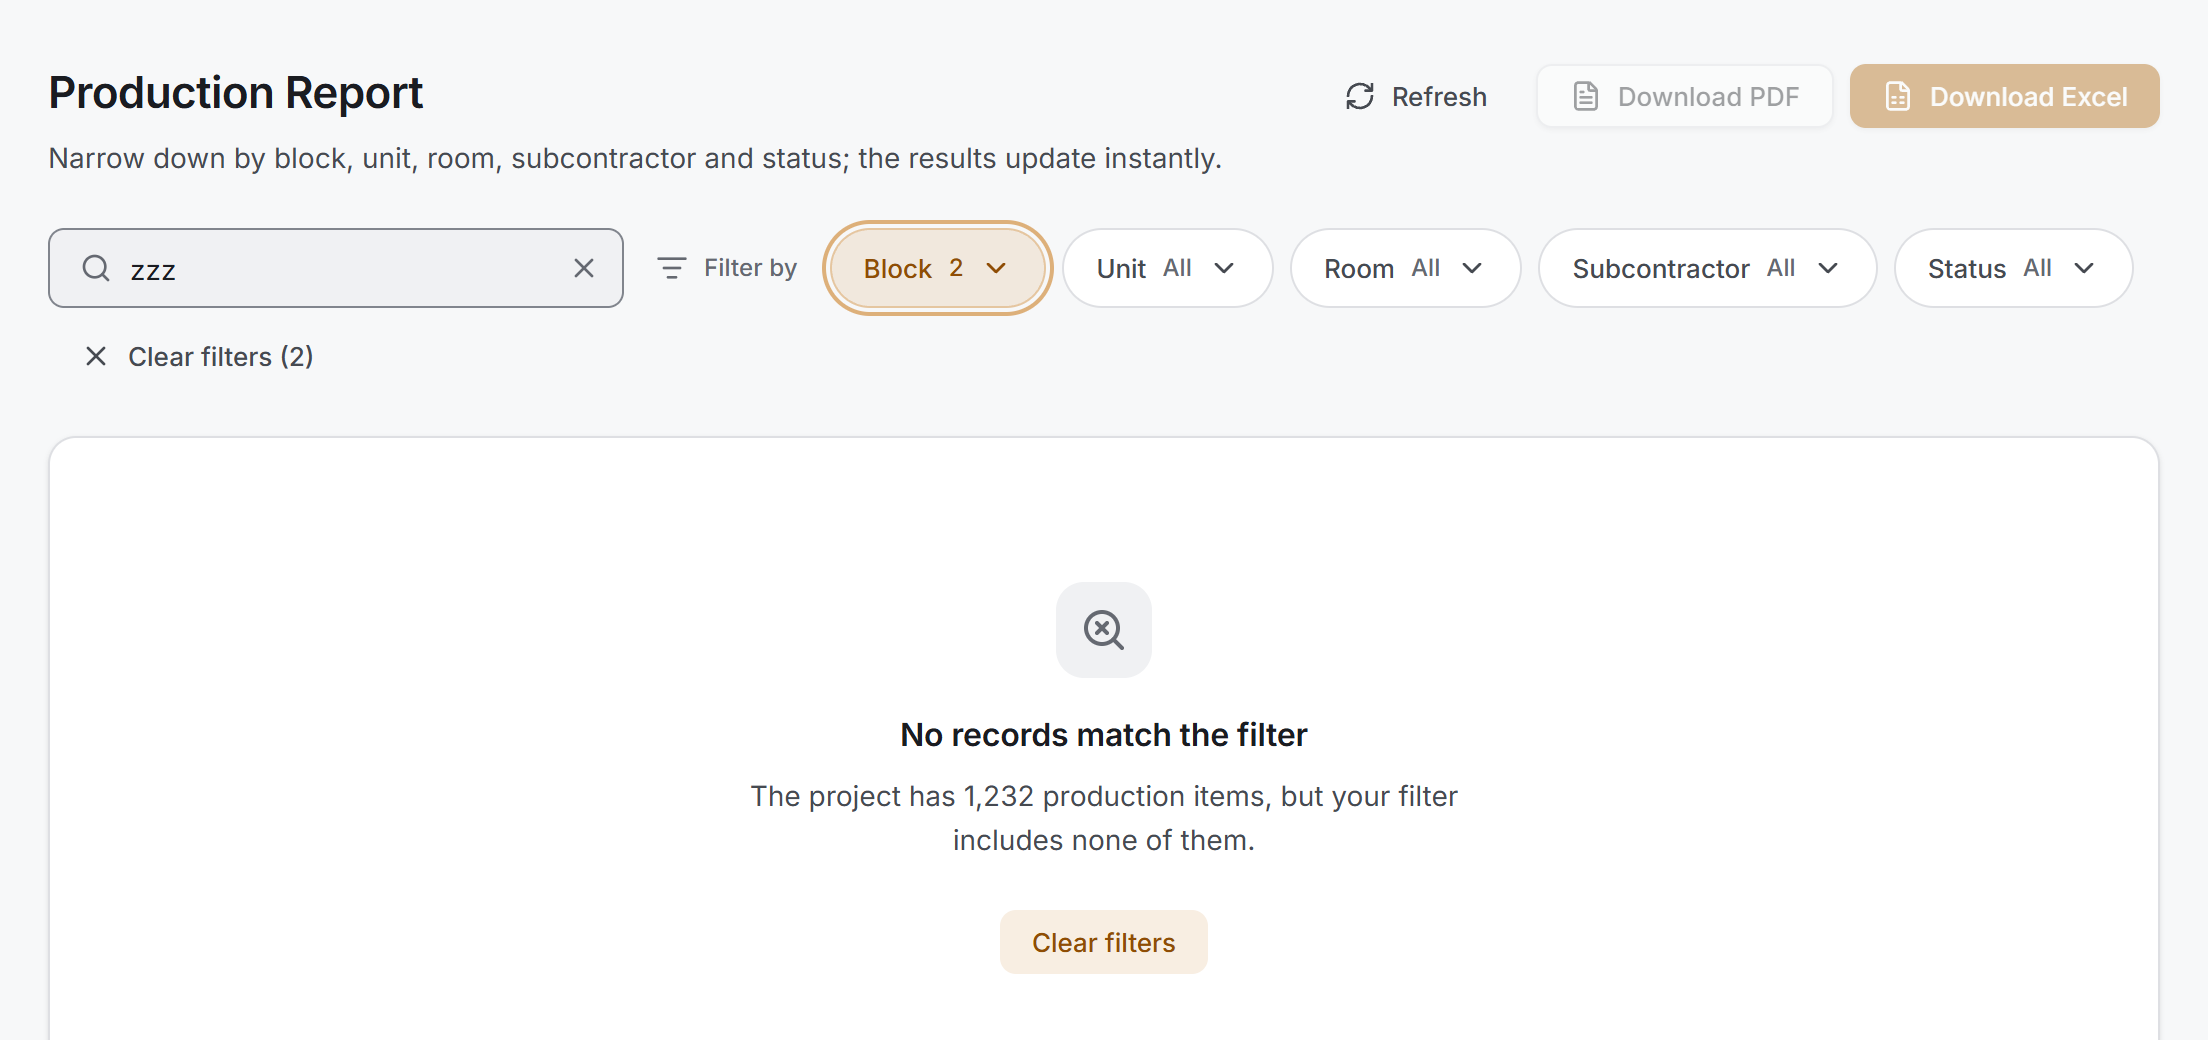
The summary strip and the breakdown cards are not drawn; a single sentence stands in their place: "No records match the filter", with the number of production items in the project below it. The Clear filters button next to it empties every selection and the search in one go.
Both export buttons dim at the same time. That is why a single sentence and a single button are left instead of three empty boxes: there is only one thing to do, and that is to loosen the filter.
4. Fields
Nothing is filled in on this page; the table columns show values entered in Site Data Entry.
| Column | What it means | Sortable |
|---|---|---|
| Room | The room the production item is in | Yes |
| Production item | The name of the item. This is the identity of the row, so it is bold | Yes |
| Subcontractor | The firm doing the work | Yes |
| Status | Not done · In progress · Done — as a badge | Yes |
| Note | The note written on site. At most two lines are shown; the full text appears on hover | No |
| Date | The date the production item was last updated | Yes |
| Updated by | The person who last changed the status | Yes |
An empty cell is marked with —. That says the value is empty, not that the row has slipped.
Special names
In a few cases the report writes an explanation instead of the record's own name. These are not invented values; they state that the data really is like that.
| What it says | What it means |
|---|---|
| Unknown location | The room, unit or block the production item belongs to cannot be resolved. These rows are collected in their own group at the very end of the list |
| No subcontractor assigned | No subcontractor was ever chosen for the production item |
| Unknown subcontractor | A subcontractor was chosen for the production item, but that firm's record has been deleted |
| Unrecognised status | The record's status is not one of the three values and carries no readable text either |
Calculated measures
| Measure | How it is calculated |
|---|---|
| Completion | The share of records in the filter whose status is Done |
| Scope | The number of records in the filter, next to the project total |
| Block progress | In each block, the Done count over that block's total |
| Subcontractor distribution | Each firm's record count in the three statuses, and the total |
| Group ratio | The group's Done count over the group total |
All of them are counted from the rows on screen. When you change the filter all five change together, and none of them goes to the server.
5. Step by step
5.1 Narrowing the report down
- Press the chip for the axis you want to narrow — Block, for example.
- Tick one or more boxes in the list. The result updates on every click.
- To add another axis, close the menu and move on to the next chip.
- To lift the filter, use either the Clear button at the bottom of the menu (that chip only) or the Clear filters button to the right of the chips (all of them at once).
Several selections on the same chip mean "or": if A Blok and B Blok are both selected on the Block chip, the records of both enter the list. Selections on different chips mean "and": if Block is A Blok and Status is Not done, only the unfinished production items of A Blok remain.
5.2 Searching
What you type into the search box is looked for in the production item name, the note and the subcontractor name.
The search is tolerant of Turkish letters: typing sihhi brings up Sıhhi tesisat, typing istanbul brings up İstanbul records. You will find what you are looking for even without a Turkish keyboard.
The search works together with the chips; neither cancels the other.
5.3 Sorting and collapsing the table
- Click the heading of the column you want to sort by. A second click reverses the direction.
- Click a group heading to collapse or expand that single group.
- To close every group at once, use the Collapse all button at the top right of the card.
When you sort by the Status column, rows are arranged by progress, not alphabetically: Not done → In progress → Done.
5.4 Moving around a long list
The table draws 200 rows when it first opens. If there are more, a line below the list states how many are shown and how many remain, with a Show more button next to it; each press opens 200 more. The heading of a group whose budget has run out states how many of its rows are hidden.
Changing the filter resets this counter.
5.5 Refreshing the report
The Refresh button in the header reads the report from the server again. The report is a snapshot: it shows the data as of the moment you opened it, and it does not refresh itself while you work with the filters. If you want to see a record entered on site in the meantime, you have to refresh.
6. Exports
Both exports write the filter that is on screen and carry the same figures. When you press the button, Windows' save dialog opens; the file name comes ready and you choose where it goes.
The file name starts with Production_Report_… and a date stamp is appended, so two reports saved into the same folder do not overwrite one another.
Excel
A single-sheet workbook; the sheet is named Production Report.
| Row | What is in it |
|---|---|
| 1 | The project name |
| 2 | Report date · Total records · Completion percentage · the three status counts |
| 3 | The filter applied — if there is none, "No filter applied — whole project." |
| 5 | Column headings |
| 6 onwards | The records |
The columns, left to right: Block · Unit · Room · Subcontractor · Production item · Note · Status · Date · Updated by. That is two more than the table on screen, because the file has no group headings and the block and unit are written on every row.
The heading row is frozen and an auto filter is switched on over it: whoever opens the file can ask their own question independently of our filter. The production item name is bold, the note is italic, and the status cell is written in the colour of that status.
A landscape A4 document.
- The top of the first page carries the project name, below it "Production Report · date time" and the filter applied. The top right carries the record count, the completion percentage and the distribution of the three statuses.
- The table carries the same nine columns as Excel, and the heading row is repeated on every page.
- From the second page onwards a thin strip at the top carries the project name and the report date.
- The page number is written at the bottom of every page.
The large report warning
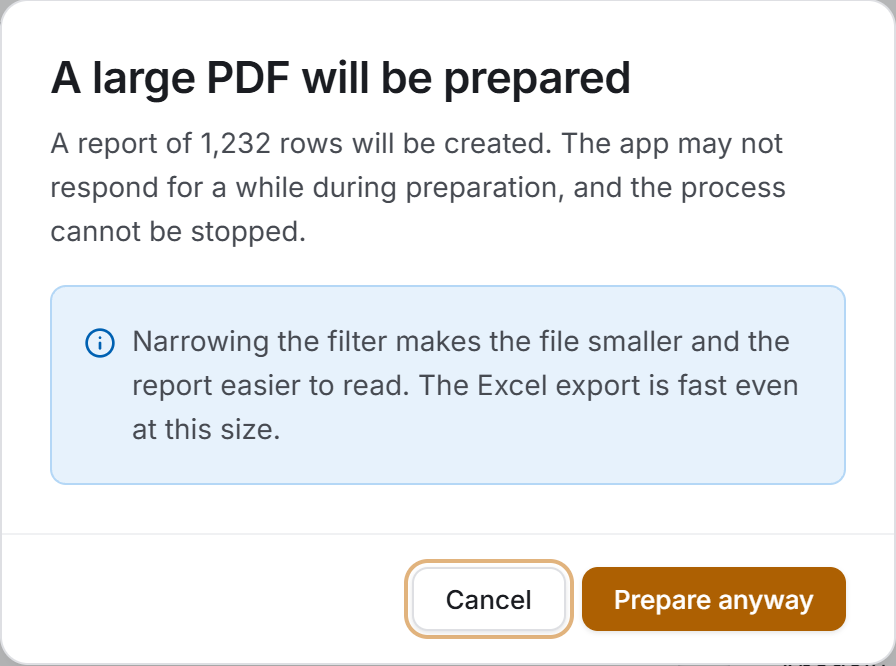
If more than 1,000 rows fall inside the filter, the PDF asks first: "A large PDF will be prepared." The dialog states how many rows there will be, and that the app may not respond for a while during preparation and that the process cannot be stopped. The information strip inside it suggests narrowing the filter and reminds you that the Excel export is fast even at this size.
If you want to carry on, say Prepare anyway.
7. Things worth knowing
The report is a snapshot. The data comes down once when the page opens and stays fixed while you work with the filters. Refreshing happens in one place and in plain sight: Refresh. That is the price of the filter being instant, and it was chosen deliberately.
The filter is written into the export. On the third row of the Excel file and under the heading of the PDF, the filter it was taken with is written down. Without that line, a report taken with two blocks selected would be taken for the whole project once it was sent by email.
An empty report can have two different causes, and the screen tells them apart. If the project has no production items at all, the page only says "No production records in this project yet" and does not even draw the filter bar — there is no filter to loosen. If the filter brings nothing, it says "No records match the filter", states how many production items the project has, and puts a Clear filters button next to it.
If the report brings no data at all, look at Site Data Entry. The page produces no records of its own; every row you see was entered there.
If every row falls into the "Unknown location" group, that is a data problem. A handful of such records is normal (broken records left over from the old application); all of them being there means the room chain the production items hang from cannot be read. In that case let your project manager know.
Completion counts production items, not quantities or amounts. The percentage says how many items are finished; large and small items count the same. For financial progress look at Progress Payments, and for progress against the schedule look at Production Planning.
In a narrow window the table scrolls sideways inside itself. There is a minimum width at which the seven columns can stand without being squeezed; in the app's narrowest state the table falls below that limit and scrolls horizontally inside its box. Because the scrollbar is hidden throughout the app, there is no visible sign of this. You have leverage: collapse the sidebar, or make the window bigger. Since the app opens full screen, you will not run into this in daily use.
The same name can exist in two blocks, and the report keeps them apart. Because groups are separated by identity rather than by name, "Daire 1" stands in its own group in each block.
The page shares its data with Site Daily Report. If you open the job picker in Site Daily Report after opening this report, the list comes ready; the same records are not downloaded a second time.
8. Related sections
- Site Data Entry — every row of this report is entered there. Corrections, additions and deletions are done from there.
- Overview — draws its completion percentage and its site feed from the same production records; it counts the same total as the scope figure here.
- Subcontractors — subcontractor names come from there. If a firm is deleted there, the report shows it as Unknown subcontractor.
- Site Daily Report — the job picker in the daily report uses the same production item list.
- Progress Payments — production items marked Done enter a progress payment if they are tied to a contract.
- Production Planning — describes the progress of the same production items against the calendar.